- The typical home in areas with LGBTQ+ housing protections costs $492,290, compared with $357,010 for the typical home in areas without protections.
- San Francisco and Portland, OR have the highest share of LGBTQ+ adults, yet less than 7% of homes in those places are affordable for someone on the local median income.
- Detroit and Rochester are the most affordable metros in states with LGBTQ+ protections.
- A Redfin survey found that over half of LGBTQ+ homeowners and renters struggle to afford housing payments.
- 13% of LGBTQ+ survey respondents planning to move soon want to relocate so they can live in an area that’s more accepting/inclusive.
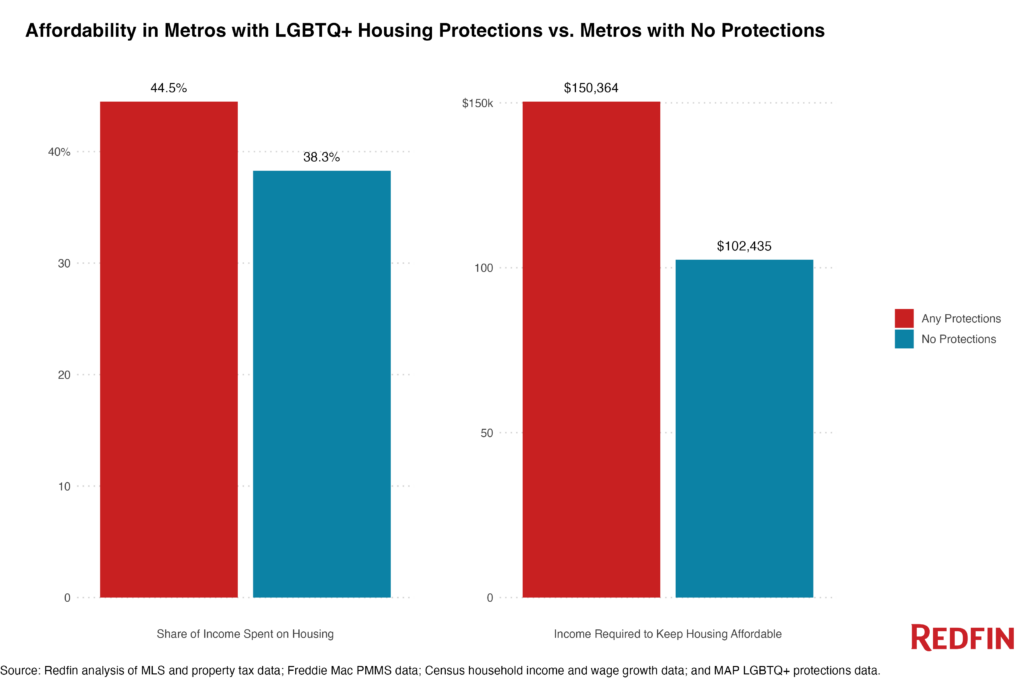
U.S. homebuyers need to earn an annual income of $150,364 to afford the median priced home in areas with state laws protecting LGBTQ+ people from housing discrimination. That’s 46.8% more than the $102,435 buyers need to earn to afford a home in areas without such protections. Both of those are higher than the $79,689 estimated median U.S. household income in 2023.
This is according to a Redfin analysis of 2023 housing market data across 54 major U.S. metropolitan areas, state-level data on housing nondiscrimination laws from the Movement Advancement Project, and estimated median local household incomes. We consider a home affordable if a buyer taking out a mortgage on the median local household income would spend no more than 30% of their income on their monthly housing payment. We assume a 10% down payment.
Now let’s look at the data another way: Someone making the median household income in areas with LGBTQ+ protections would’ve had to spend 44.5% of their earnings on monthly housing costs if they bought a home for $492,290, the median home sale price in those areas last year. By comparison, buyers in areas without protections would’ve had to spend 38.3% of their earnings if they purchased the $357,010 median priced home in their area. A rule of thumb in personal finance is that people should spend no more than 30% of their income on housing, but that has become less realistic due to elevated mortgage rates and home prices.
Housing nondiscrimination laws shield LGBTQ+ individuals against being evicted unfairly, denied housing, or prevented from renting or buying based on their sexual orientation and/or gender identity. For the purposes of this report, a metro has “any protections” if at least one of the states it’s located in prohibits discrimination based on sexual orientation and/or gender identity. Please note that some metro areas span several states. In those cases, we deem the metro to have protections if at least one state has protections, unless otherwise noted. LGBTQ+ people in states without explicit protections are protected under the federal Fair Housing Act.
“LGBTQ+ Americans face disproportionately large barriers to homeownership,” said Redfin Senior Economist Elijah de la Campa. “On top of paying a premium to live somewhere that feels safe, many LGBTQ+ house hunters are earning less than the typical U.S. worker, and face discrimination while shopping for homes despite laws that prohibit it.”
More than one in five (22%) LGBTQ+ people who recently moved believe they were discriminated against based on their sexual orientation during their most recent home search, according to a 2023 survey commissioned by Redfin. A separate 2024 survey commissioned by Redfin found that 12.7% of LGBTQ+ respondents planning to move in the next year want to relocate so they can live in an area where people are more accepting/inclusive of LGBTQ+ people.
Places With the Largest LGBTQ+ Populations Have the Smallest Share of Affordable Homes
In the metros where LGBTQ+ people make up the largest share of the adult population, less than 10% of home listings are affordable for someone earning the median local household income.
In San Francisco, 6.7% of the adult population identifies as LGBTQ+, the highest share among the metros Redfin analyzed. Yet only 5.1% of listings last year were affordable on the median local income—one of the lowest shares in the country. Portland, OR has the second highest share of LGBTQ+ adults (6%), and only 6.7% of homes for sale were affordable. In Austin, TX, 5.9% of the adult population identifies as LGBTQ+, and just 2.9% of listings were affordable. And in Seattle and Los Angeles, LGBTQ+ adults make up 5.2% and 5.1% of the population, and a respective 4.8% and 1.9% of homes for sale were affordable. All but one of those metros—Austin—has state-level LGBTQ+ protections.
In all five aforementioned metros, someone making the median local income in 2023 would’ve had to spend more than 45% of their earnings on monthly housing costs to buy the median-priced home. All five metros also had a median home sale price above the national level of $410,252.
A much larger share of listings are affordable in metros with lower shares of LGBTQ+ adults.
In Pittsburgh, 3.3% of the adult population identifies as LGBTQ+, the smallest share in the country (tied with Raleigh, NC). More than half of listings in Pittsburgh (57.4%) and nearly one in five in Raleigh (17.8%) were affordable for someone on the median local income. Omaha, NE has the next lowest share of LGBTQ+ adults (3.4%), and almost one-third (30%) of homes for sale were affordable. In Milwaukee and Houston, LGBTQ+ people make up 3.5% of the adult population, and a respective 38.9% and 16.7% of listings were affordable. Pittsburgh, Raleigh and Houston have no state-level protections for LGBTQ+ people, while Omaha and Milwaukee do.
Detroit and Rochester Are the Most Affordable Places to Live with LGBTQ+ Protections
Thirty of the 54 metros Redfin analyzed are in states with protections for LGBTQ+ people. Of those 30 metros, the most affordable are in the Northeast and Midwest.
In Rochester, NY, 55.5% of home listings last year were affordable for someone earning the median local household income—the highest share among metros in states with LGBTQ+ protections. Next comes Detroit (55.3%), Buffalo, NY (50.3%), Baltimore (48%) and Albany, NY (41.1%). In all five of those metros, the median home sale price was below the national level of $410,252, and the typical buyer would’ve had to spend roughly 30% of their income on monthly housing payments.
While upstate New York remains more affordable than many parts of the country, its housing market is heating up. In Rochester, 84.6% of homes that went under contract in April did so within two weeks—a higher share than any other major metro. And in Buffalo, prices jumped 24.3% from a year earlier, a bigger gain than any other major metro.
Note: The St. Louis, MO-IL CBSA has a slightly higher share of affordable listings (55.8%) than Rochester, but we removed it from this section because there are no explicit LGBTQ+ housing protections in Missouri, the primary state of the St. Louis CBSA. There are protections in Illinois, which contains approximately 25% of the metro area’s population.
LGBTQ+ People Are More Likely to Make Sacrifices to Cover Housing Costs
More than half (56.5%) of LGBTQ+ homeowners and renters sometimes, regularly or greatly struggle to afford their housing payments. That compares with 49.9% of U.S. homeowners and renters as a whole. This is according to a Redfin-commissioned survey conducted by Qualtrics in February 2024.
One-quarter of LGBTQ+ respondents (24.5%) who indicated that they sometimes, regularly or greatly struggle to afford their housing payments said they borrowed money from family or friends in order to afford their monthly housing costs. That compares with 17% of non LGBTQ+ respondents. LGBTQ+ respondents were also nearly three times more likely to say they decided against or delayed having a child in order to cover housing expenses.
Here’s a full list of the survey question responses:
| “Which of the following, if any, changes or sacrifices did you make in the past year to afford your monthly housing costs, including mortgage or rent, insurance, parking heating/cooling/electricity or homeownership association dues? Select all that apply.” | LGBTQ+ | Non LGBTQ+ |
| Took no or fewer vacations | 29.8% | 35.1% |
| Sold my belongings | 27.7% | 19.7% |
| Skipped meals | 27.6% | 21.3% |
| Worked additional hours/shifts at my job | 26.0% | 20.0% |
| Borrowed money from friends/family that I will pay back | 24.5% | 17.0% |
| Worked an extra job regular job | 21.3% | 14.6% |
| Received money from friends/family that is not expected to be paid back | 20.1% | 13.5% |
| Dipped into retirement savings | 17.9% | 17.5% |
| Worked a side hustle such as Uber driver or food delivery | 17.9% | 14.3% |
| Moved in with a romantic partner | 16.9% | 4.7% |
| Moved in with other family members | 16.4% | 4.0% |
| Delayed or skipped healthcare/medical treatments | 13.8% | 15.8% |
| Moved in with parents | 12.9% | 3.7% |
| None of these | 10.0% | 20.4% |
| Slept in homeless shelter | 9.3% | 2.8% |
| Decided against or delayed having a child | 9.0% | 3.6% |
| Slept in car | 8.8% | 4.2% |
| Moved in with roommates | 5.7% | 3.4% |
| Gave up or reduced college savings for their kids | 5.5% | 2.2% |
| Moved in with my grown children | 3.4% | 1.9% |
| Postponed getting a divorce or separation | 2.5% | 1.3% |
Metro-Level Summary: Affordability and LGBTQ+ Protections
Figures in the table below represent 2023, unless otherwise noted.
| CBSA | Median Home Sale Price | Estimated Median Household Income | Income Required to Keep Home Cost Affordable | Share of Income Spent on Housing for Median Buyer | Share of Listings Affordable to Median Buyer | Housing Protections Category (2024) | LGBTQ+ Adult Population Share (2012-2017) |
|---|---|---|---|---|---|---|---|
| Albany-Schenectady-Troy, NY | $292,125 | $88,614 | $95,936 | 32.5% | 41.1% | Any Protections | 4.0% |
| Atlanta-Sandy Springs-Alpharetta, GA | $383,033 | $89,258 | $112,874 | 37.9% | 21.7% | No Protections | 4.6% |
| Austin-Round Rock-Georgetown, TX | $453,195 | $98,650 | $149,991 | 45.6% | 2.9% | No Protections | 5.9% |
| Baltimore-Columbia-Towson, MD | $358,321 | $103,320 | $108,236 | 31.4% | 48.0% | Any Protections | 4.1% |
| Boston-Cambridge-Newton, MA-NH | $598,371 | $113,199 | $183,971 | 49.3% | 8.5% | Any Protections | 4.9% |
| Buffalo-Cheektowaga, NY | $230,263 | $71,711 | $78,185 | 32.7% | 50.3% | Any Protections | 4.1% |
| Charlotte-Concord-Gastonia, NC-SC | $387,959 | $81,898 | $110,886 | 40.6% | 19.6% | No Protections | 4.0% |
| Chicago-Naperville-Elgin, IL-IN-WI | $304,622 | $90,325 | $100,741 | 32.5% | 37.6% | Any Protections | 4.1% |
| Cincinnati, OH-KY-IN | $269,775 | $81,535 | $81,753 | 30.1% | 42.7% | No Protections | 3.6% |
| Cleveland-Elyria, OH | $204,338 | $71,422 | $66,225 | 27.8% | 56.6% | No Protections | 3.8% |
| Columbus, OH | $321,075 | $83,396 | $97,816 | 35.2% | 33.0% | No Protections | 4.4% |
| Dallas-Fort Worth-Arlington, TX | $387,019 | $90,084 | $125,726 | 42.3% | 9.1% | No Protections | 4.0% |
| Denver-Aurora-Lakewood, CO | $572,013 | $104,320 | $163,546 | 47.0% | 10.4% | Any Protections | 4.8% |
| Detroit-Warren-Dearborn, MI | $228,740 | $84,658 | $70,589 | 27.9% | 55.3% | Any Protections | 3.9% |
| Hartford-East Hartford-Middletown, CT | $320,888 | $94,330 | $105,200 | 33.5% | 35.6% | Any Protections | 4.6% |
| Houston-The Woodlands-Sugar Land, TX | $331,041 | $84,237 | $108,625 | 38.7% | 16.7% | No Protections | 3.5% |
| Indianapolis-Carmel-Anderson, IN | $289,358 | $81,687 | $86,176 | 31.6% | 40.6% | No Protections | 4.6% |
| Jacksonville, FL | $364,174 | $79,410 | $107,217 | 40.5% | 17.8% | No Protections | 4.2% |
| Kansas City, MO-KS | $309,592 | $85,516 | $93,101 | 32.7% | 37.2% | No Protections | 3.8% |
| Las Vegas-Henderson-Paradise, NV | $410,229 | $74,135 | $116,583 | 47.2% | 10.1% | Any Protections | 5.1% |
| Los Angeles-Long Beach-Anaheim, CA | $939,406 | $102,209 | $272,500 | 80.4% | 1.9% | Any Protections | 5.1% |
| Louisville/Jefferson County, KY-IN | $254,432 | $75,662 | $75,230 | 29.8% | 44.0% | No Protections | 4.2% |
| Miami-Fort Lauderdale-Pompano Beach, FL | $459,646 | $74,445 | $137,292 | 55.8% | 15.2% | No Protections | 4.5% |
| Milwaukee-Waukesha, WI | $297,329 | $79,610 | $93,189 | 35.1% | 38.9% | Any Protections | 3.5% |
| Minneapolis-St. Paul-Bloomington, MN-WI | $365,700 | $101,006 | $110,752 | 32.9% | 32.0% | Any Protections | 4.2% |
| Nashville-Davidson--Murfreesboro--Franklin, TN | $442,753 | $86,494 | $125,579 | 43.6% | 9.7% | No Protections | 3.7% |
| New Orleans-Metairie, LA | $274,930 | $67,026 | $79,762 | 35.7% | 27.5% | No Protections | 4.7% |
| New York-Newark-Jersey City, NY-NJ-PA | $576,681 | $102,384 | $186,619 | 51.5% | 11.3% | Any Protections | 4.5% |
| Oklahoma City, OK | $255,184 | $72,205 | $74,750 | 31.1% | 31.8% | No Protections | 3.8% |
| Omaha-Council Bluffs, NE-IA | $296,042 | $85,031 | $92,114 | 32.5% | 30.0% | Any Protections | 3.4% |
| Orlando-Kissimmee-Sanford, FL | $396,631 | $76,022 | $116,709 | 46.1% | 13.0% | No Protections | 5.0% |
| Philadelphia-Camden-Wilmington, PA-NJ-DE-MD | $335,424 | $96,013 | $104,964 | 33.5% | 38.5% | Any Protections | 4.2% |
| Phoenix-Mesa-Chandler, AZ | $442,243 | $84,854 | $124,982 | 44.2% | 8.0% | No Protections | 4.3% |
| Pittsburgh, PA | $218,108 | $75,795 | $68,110 | 27.0% | 57.4% | No Protections | 3.3% |
| Portland-Vancouver-Hillsboro, OR-WA | $536,366 | $96,258 | $159,724 | 49.8% | 6.7% | Any Protections | 6.0% |
| Providence-Warwick, RI-MA | $436,801 | $85,910 | $133,444 | 46.6% | 8.0% | Any Protections | 4.5% |
| Raleigh-Cary, NC | $433,758 | $97,708 | $125,661 | 38.6% | 17.8% | No Protections | 3.3% |
| Richmond, VA | $364,954 | $88,324 | $105,934 | 36.0% | 26.1% | Any Protections | 4.1% |
| Riverside-San Bernardino-Ontario, CA | $545,750 | $86,058 | $160,612 | 56.0% | 5.1% | Any Protections | 4.0% |
| Rochester, NY | $222,890 | $75,644 | $76,846 | 30.5% | 55.5% | Any Protections | 4.3% |
| Sacramento-Roseville-Folsom, CA | $560,015 | $95,051 | $165,091 | 52.1% | 4.1% | Any Protections | 4.4% |
| St. Louis, MO-IL | $245,917 | $81,383 | $75,137 | 27.7% | 55.8% | Any Protections | 3.7% |
| Salt Lake City, UT | $505,315 | $95,795 | $145,789 | 45.7% | 5.0% | Any Protections | 4.7% |
| San Antonio-New Braunfels, TX | $312,444 | $75,953 | $102,086 | 40.3% | 11.4% | No Protections | 4.4% |
| San Diego-Chula Vista-Carlsbad, CA | $845,646 | $102,833 | $246,302 | 71.9% | 1.1% | Any Protections | 4.5% |
| San Francisco-Oakland-Berkeley, CA | $1,246,194 | $142,258 | $365,674 | 75.7% | 5.1% | Any Protections | 6.7% |
| San Jose-Sunnyvale-Santa Clara, CA | $1,428,812 | $161,374 | $415,625 | 77.3% | 2.1% | Any Protections | 3.8% |
| Seattle-Tacoma-Bellevue, WA | $650,207 | $112,255 | $193,646 | 53.2% | 4.8% | Any Protections | 5.2% |
| Tampa-St. Petersburg-Clearwater, FL | $372,329 | $71,390 | $109,939 | 46.2% | 13.7% | No Protections | 4.8% |
| Tucson, AZ | $358,112 | $68,209 | $103,821 | 45.7% | 7.8% | No Protections | 4.7% |
| Tulsa, OK | $256,478 | $69,716 | $74,140 | 31.9% | 32.4% | No Protections | 4.1% |
| Virginia Beach-Norfolk-Newport News, VA-NC | $329,690 | $84,269 | $97,706 | 34.8% | 29.4% | Any Protections | 4.1% |
| Washington-Arlington-Alexandria, DC-VA-MD-WV | $529,259 | $130,306 | $158,426 | 36.4% | 31.3% | Any Protections | 4.5% |
| Worcester, MA-CT | $415,925 | $93,228 | $127,850 | 41.1% | 17.5% | Any Protections | 4.5% |
Methodology
This report is based on a Redfin analysis of estimated median local household incomes and median monthly housing payments. Median monthly housing payments are calculated using the prevailing median home sale price and average mortgage-interest rate, and assume a 10% down payment. Incomes for 2023 are estimated using the U.S. Census Bureau’s (ACS) 2022 median household income and 12-month moving average nominal wage growth rates compiled from the Current Population Survey and reported by the Federal Reserve Bank of Atlanta.
We factor the following into our calculations: the mortgage principal, interest, property taxes, homeowners’ insurance and mortgage insurance. In this report, the word “homebuyer” refers to someone who is taking out a loan to finance their purchase. We consider a home “affordable” if a buyer taking out a mortgage spends no more than 30% of their income on their housing payment.
Redfin analyzed 54 major U.S. metropolitan areas—those for which the Williams Institute had 2012-2017 data on the share of LGBTQ+ adults (the most recent years for which data is available). We classify metro areas as having LGBTQ+ protections if at least one state within the CBSA has state laws that prohibit housing discrimination on the basis of sexual orientation and/or gender identity/expression. Data on LGBTQ+ protections is as of Jan. 1, 2024.