- Rural homebuyers need to earn $75,000 to afford the typical home, up from $36,000 before the pandemic. Suburban and urban areas have also seen affordability erode—but not as severely.
- The median home sale price in rural areas is up 61% from before the pandemic, compared with a 49% increase in suburban areas and a 46% gain in urban areas.
- The median household income in rural areas has climbed 33%, less than the 37% increase in suburban areas and the 39% uptick in urban areas.
Rural America has been hit by a one-two punch of rising home prices and lagging incomes, and as a result has seen housing affordability erode faster than big cities and suburbs.
Homebuyers need to earn an annual income of $74,508 to afford the median-priced home in rural U.S. counties. That’s up 105.8% from before the pandemic, when rural buyers needed to earn $36,206.
By comparison, the income needed to afford a home in suburban counties has risen 90.9% (to $102,120 from $53,482), and the income needed to afford a home in urban counties has climbed 87.5% (to $118,300 from $63,103).

This is based on a Redfin analysis that compares the third quarter of 2025 with the third quarter of 2019. We consider a home affordable if a buyer taking out a mortgage spends no more than 30% of their income on their monthly housing payment. This analysis uses MLS median home sale price data, prevailing mortgage rates and property-tax payments, and U.S. Census Bureau data on incomes.
Homebuyers in rural areas have faced relatively large jumps in home prices, which is one reason affordability has eroded. The median sale price in rural counties is $280,900, up 60.5% from $175,000 before the pandemic. By comparison, suburban counties have seen a 48.9% increase (to $385,000 from $258,500) and urban counties have experienced a 46.2% gain (to $446,000 from $305,000).
Income growth also hasn’t kept up. The median household income in rural counties is $69,307, up 33.3% from $52,002 before the pandemic. By comparison, suburban counties have seen a 36.8% gain (to $88,627 from $64,782) and urban counties have seen a 39.3% gain (to $89,784 from $64,468).
Big cities fell out of favor during the pandemic, when scores of Americans moved to rural and suburban areas in search of space, privacy and access to nature. Some were seeking a lower cost of living, while others were buying up pricey vacation homes in places like Lake Tahoe. Record-low mortgage rates and remote work were the forces that empowered millions to relocate. The pandemic homebuying frenzy that swept through rural and suburban areas sent home prices soaring, leaving many communities grappling with an affordability crisis that persists today. Rural areas often only have a handful of homes for sale, meaning homebuyers frequently compete with one another—another factor that drives up prices.
“During the pandemic, many buyers came to New Hampshire from out of state—places like New York, Texas, California, and Seattle. They often had larger budgets than locals and were able to pay above the asking price, which helped them win bidding wars and purchase properties in the Lakes Region,” said Julia Martinage, a Redfin Premier real estate agent in New Hampshire. “A lot of those people are now moving back to where they came from and being replaced by locals or people from border states like Massachusetts. I’m seeing a lot of young couples and families moving to rural areas from cities like Nashua and Manchester. They want land, chickens, quiet—a better quality of life.”
The Lakes Region of New Hampshire made Redfin’s 2020 list of Hottest Neighborhoods—a ranking that forecasts the most competitive housing markets for the coming year.
Many affluent Americans purchased second homes in rural areas during the pandemic, and this influx of high earners exacerbated affordability challenges for locals. Please note that incomes of second-home buyers aren’t reflected in the data in this report because Census income data only covers people who list an area as their primary residence.
Rural Areas Continue to Attract Homebuyers Because They Remain Relatively Affordable
While rural areas have seen the fastest uptick in home prices in recent years, they remain affordable compared to many suburban and urban areas—one reason people continue to move to rural America.
A household on the median income in rural counties would need to spend 32.3% of their earnings on housing to buy the median-priced home. While that’s up from 20.9% before the pandemic, it remains lower than the share in suburban and urban areas. In suburban counties, a household on the median income would need to spend 34.6% of their income to buy the typical home, and in urban counties, it would need to spend 39.5%.
“It used to be that if you couldn’t afford the city of Portsmouth, you went north to the suburb of Dover,” said Martinage, the New Hampshire agent. “Then Dover got expensive, so people went further north to the suburbs of Rochester or Farmington. Now even those areas are out of reach for a lot of people.”

A rule of thumb in personal finance is to spend no more than 30% of income on housing, but that has become less realistic as housing costs have climbed.
Another way to gauge affordability is to compare the following factors: what the typical household earns and what a household would need to earn in order to “afford” the typical home, i.e., spend no more than 30% of their income on housing. The typical household in rural counties earns 7% less than it needs to afford the typical home, but the gap is much larger in suburban and urban areas, where the typical household earns a respective 13.2% and 24.1% less than needed.
Rural America still has the lowest home prices but is also still seeing the fastest growth—the median sale price rose 2.6% year over year in the third quarter versus a 1.4% gain in urban areas and a 1.3% increase in suburban areas. The good news is that even though prices are rising, affordability has improved slightly across the board over the past year. In rural areas, the share of income needed to buy the typical home has dropped to 32.3% from 33.1% in the third quarter of 2024. Suburban areas saw a drop to 34.6% from 36%, and urban areas saw a drop to 39.5% from 41.2%. That’s because incomes have grown faster than home prices. Household incomes rose 4.2% year over year in rural areas and 4.4% in both suburban and urban areas.
“Rural America isn’t as affordable as it once was, but the silver lining is that unlike many urban areas, there’s still room to build homes,” said Redfin Senior Economist Asad Khan. “Adding more housing can ease the affordability crunch and also make room for more people, which can boost local economies.”
Governments in some states are actively seeking to combat the rural housing shortage through building. New York, for example, just invested $50 million in a program that will build manufactured housing, which is typically cheaper and quicker to construct.
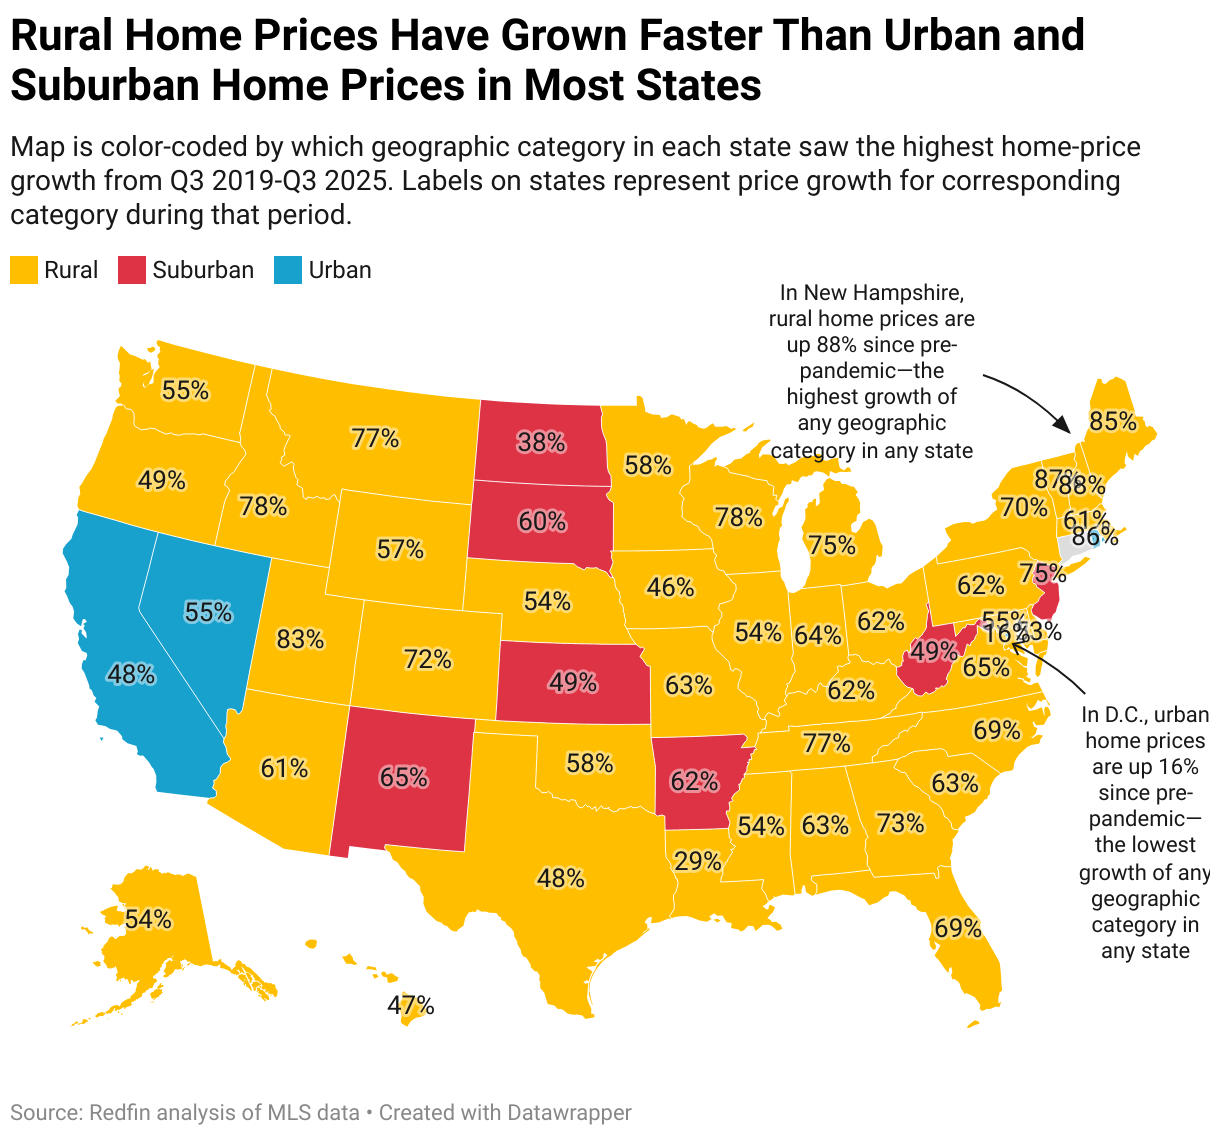
New Hampshire Has Seen the Biggest Increase in Income Needed to Afford a Rural Home
Homebuyers need to earn an annual income of $119,361 to afford the median-priced home in rural New Hampshire. That’s up 141.4% from before the pandemic—a bigger increase than rural areas in any other state Redfin analyzed. It’s followed by neighboring Vermont and Maine, which saw respective increases of 139.2% and 137.3%.
These states top the list because they’ve seen the largest increases in home prices. The median rural home sale price in New Hampshire is up 88.3% from before the pandemic—a bigger increase than any other state Redfin analyzed. Next came Vermont and Maine, with respective increases of 86.6% and 85.1%.
Rural Housing Affordability Summary by State
The table below covers rural counties only across 47 states; Connecticut is excluded due to insufficient data, and Rhode Island and Washington, D.C. are excluded because they have no counties that are considered predominantly rural, per the NCHS classification scheme. Data represents the third quarter of 2025, with the exception of median household income data, which represents an estimate for the entire year. See methodology below for more details.
| State | Income required to afford the median-priced home | Change in income required to afford the median-priced home since pre-pandemic | Median household income | Change in median household income since pre-pandemic | Median home sale price | Change in median home sale price since pre-pandemic |
|---|---|---|---|---|---|---|
| Alabama | $64,455 | 109.1% | $61,741 | 37.5% | $243,000 | 63.1% |
| Alaska | $98,009 | 97.4% | $85,311 | 29.1% | $369,500 | 54.0% |
| Arizona | $105,661 | 106.2% | $57,903 | 44.5% | $398,350 | 60.8% |
| Arkansas | $50,927 | 98.5% | $56,212 | 29.3% | $192,000 | 54.8% |
| California | $119,229 | 72.0% | $73,300 | 30.1% | $449,500 | 34.2% |
| Colorado | $171,084 | 120.5% | $92,814 | 35.1% | $645,000 | 72.0% |
| Delaware | $118,035 | 96.7% | $85,794 | 35.8% | $445,000 | 53.4% |
| Florida | $94,163 | 116.7% | $60,447 | 30.0% | $355,000 | 69.0% |
| Georgia | $84,876 | 121.8% | $63,743 | 39.0% | $319,990 | 73.0% |
| Hawaii | $167,106 | 87.8% | $84,754 | 35.8% | $630,000 | 46.5% |
| Idaho | $119,096 | 128.4% | $71,543 | 42.4% | $449,000 | 78.2% |
| Illinois | $40,848 | 97.4% | $70,837 | 34.8% | $154,000 | 54.0% |
| Indiana | $56,551 | 110.4% | $71,951 | 34.2% | $213,200 | 64.1% |
| Iowa | $47,744 | 87.6% | $73,063 | 33.9% | $180,000 | 46.3% |
| Kansas | $44,827 | 80.7% | $66,405 | 28.4% | $169,000 | 41.0% |
| Kentucky | $59,954 | 107.0% | $62,564 | 37.9% | $226,033 | 61.5% |
| Louisiana | $47,744 | 65.0% | $50,093 | 24.8% | $180,000 | 28.7% |
| Maine | $82,227 | 137.3% | $71,415 | 29.0% | $310,000 | 85.1% |
| Maryland | $96,815 | 99.1% | $89,408 | 40.8% | $365,000 | 55.3% |
| Massachusetts | $104,773 | 106.7% | $79,671 | 30.7% | $395,000 | 61.2% |
| Michigan | $61,007 | 124.3% | $66,823 | 38.4% | $230,000 | 75.0% |
| Minnesota | $74,243 | 102.7% | $78,061 | 35.9% | $279,900 | 58.1% |
| Mississippi | $59,681 | 96.9% | $60,175 | 33.4% | $225,000 | 53.6% |
| Missouri | $60,556 | 109.2% | $62,108 | 34.9% | $228,300 | 63.2% |
| Montana | $140,581 | 127.3% | $74,003 | 39.5% | $530,000 | 77.3% |
| Nebraska | $60,410 | 97.3% | $72,093 | 33.3% | $227,750 | 53.9% |
| Nevada | $115,382 | 95.7% | $91,573 | 37.1% | $435,000 | 52.7% |
| New Hampshire | $119,361 | 141.4% | $92,225 | 42.4% | $450,000 | 88.3% |
| New Mexico | $76,656 | 100.3% | $57,864 | 28.3% | $289,000 | 56.2% |
| New York | $61,007 | 118.4% | $72,452 | 35.0% | $230,000 | 70.4% |
| North Carolina | $87,280 | 116.3% | $63,660 | 33.9% | $329,052 | 68.8% |
| North Dakota | $71,351 | 64.7% | $88,628 | 23.0% | $269,000 | 28.4% |
| Ohio | $55,967 | 107.9% | $70,967 | 33.4% | $211,000 | 62.2% |
| Oklahoma | $54,376 | 102.2% | $62,206 | 32.9% | $205,000 | 57.7% |
| Oregon | $102,120 | 90.6% | $67,301 | 40.6% | $385,000 | 48.6% |
| Pennsylvania | $59,919 | 107.6% | $68,583 | 31.2% | $225,900 | 61.9% |
| South Carolina | $76,524 | 108.4% | $55,579 | 31.3% | $288,500 | 62.5% |
| South Dakota | $68,036 | 84.6% | $73,916 | 31.1% | $256,500 | 44.0% |
| Tennessee | $80,900 | 126.7% | $62,179 | 40.5% | $305,000 | 76.8% |
| Texas | $70,025 | 89.1% | $68,704 | 35.2% | $264,000 | 47.5% |
| Utah | $144,714 | 134.5% | $85,468 | 35.2% | $545,582 | 82.9% |
| Vermont | $103,446 | 139.2% | $78,475 | 39.7% | $390,000 | 86.6% |
| Virginia | $79,495 | 111.7% | $64,979 | 31.6% | $299,700 | 65.1% |
| Washington | $123,438 | 98.9% | $76,756 | 43.5% | $465,370 | 55.1% |
| West Virginia | $53,049 | 89.9% | $60,433 | 31.2% | $200,000 | 48.1% |
| Wisconsin | $78,778 | 127.6% | $74,873 | 31.7% | $297,000 | 77.5% |
| Wyoming | $103,420 | 101.6% | $77,773 | 22.7% | $389,900 | 57.2% |
Methodology
We consider a home affordable if a buyer spends no more than 30% of their income on their housing payment, and we are assuming that buyers are financing their home purchase with a mortgage.
The income needed to afford the typical home is calculated using the prevailing median home sale price and average mortgage-interest rate, and assumes a 20% down payment. The typical housing payments noted in this report include the mortgage principal, interest, property taxes, homeowners’ insurance and mortgage insurance. The 2025 median household income is estimated using the U.S. Census Bureau’s (ACS) 2023 median household income and 12-month moving average nominal wage growth rates compiled from the Current Population Survey and reported by the Federal Reserve Bank of Atlanta.
We rely on the NCHS Urban-Rural Classification Scheme, which is a six-level categorization of counties by how urban or rural they are. We group counties as predominantly urban, suburban, or rural. Large central metro counties are considered ‘urban’; large fringe metro, medium metro, and small metro counties as ‘suburban’; and micropolitan and noncore counties as ‘rural.’ A Pew Research analysis found this grouping corresponds well with residents’ self-reported descriptions of their communities. We exclude Connecticut from this analysis as a county-level classification is not available.