- The typical retail worker earns $34,000 per year, or 52% less than they would need to afford the typical apartment.
- Rental affordability has improved slightly in recent years; the typical retail worker earned 57% less than they would need during the pandemic moving frenzy.
- The earnings shortfall is smallest in Cleveland, where the typical retail worker earns 33% less than they would need to afford the typical apartment. New York has the largest shortfall, at 71%.
The typical retail worker in America earns $34,436 per year—51.6% less than they would need to afford the typical apartment.
A renter would need to earn $71,172 to afford the typical apartment, which costs $1,779 per month. That means the typical retail worker earns $36,736 less than they would need to afford the typical apartment, though affordability has improved slightly in recent years.
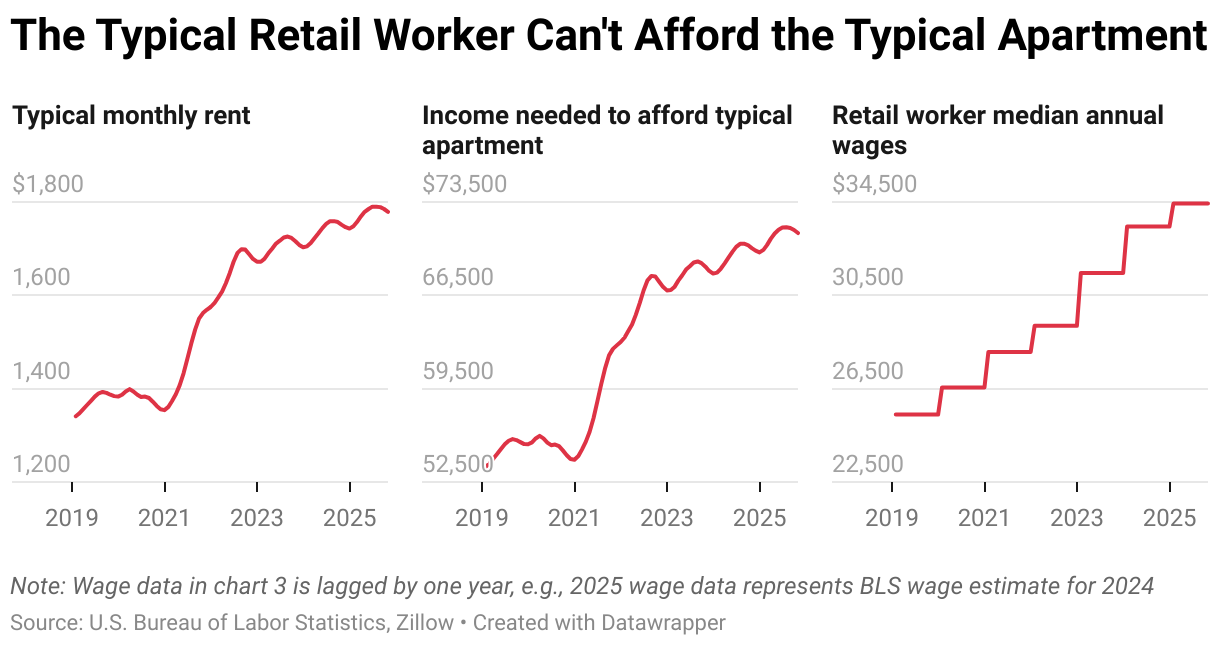
We consider a rental affordable if a renter spends no more than 30% of their income on rent. This is based on a Redfin analysis of 2024 wage estimates from the U.S. Bureau of Labor Statistics’ Occupational Employment and Wage Statistics program, and October 2025 multifamily rent data from the Zillow Observed Rent Index. Wage data covers workers in the following categories: cashiers, retail salespersons, first-line retail supervisors.
If the typical retail worker wanted to afford the typical apartment on their own, they would need to work 83 hours per week, which is obviously unrealistic for most people.
“As the cost of living has increased, so have the sacrifices renters must make to afford a place to live,” said Redfin Chief Economist Daryl Fairweather. “Since most retail workers don’t earn enough to afford the typical apartment, many are opting to share rent with a family member or friend, move far away from their job, or live in a very small space. The good news is rents are no longer rising as fast as they were during the pandemic, so rental affordability has actually improved slightly in recent years.”
Nearly 1 in 4 U.S. renters (23%) regularly or greatly struggle to afford the cost of housing, according to a Redfin-commissioned survey of roughly 1,600 renters conducted by Ipsos in May 2025. Of the 541 renters who moved within the 12 months prior to the survey, nearly 1 in 4 (23%) said they did so for lower housing costs. Many renters are eating at restaurants less often, taking fewer vacations and borrowing money from friends or family in order to make rent, Redfin reported in August.
The retail industry has been hit particularly hard by layoffs, with 88,664 job cuts this year—a 145% increase from last year, according to Challenger, Gray & Christmas. Retailers are eliminating jobs due to falling sales, rising tariffs and the impact of AI. Seasonal retail hiring is expected to fall to the lowest level in 15 years, with the National Retail Federation predicting retailers will hire 265,000 to 365,000 seasonal workers in 2025, down from 442,000 last year.
It’s worth noting that while this report analyzes the “typical” retail worker and the “typical apartment,” the reality is that many retail workers never actually seek out the typical apartment because it’s out of their price range. For that reason, we also looked at rental affordability for higher-earning retail workers—a group that is more likely to seek out the typical apartment. We found that affordability is still very strained for this cohort. Retail workers with wages in the top 25%, for example, still earn 44.2% less than they would need to afford the typical apartment.
Rental Affordability for Retail Workers Has Improved Slightly
While rental affordability for retail workers remains strained, it has improved slightly in recent years. The typical retail worker earns 51.6% less than they would need to afford the typical apartment. That’s an improvement from the 52.2% shortfall in October 2024, the 54.2% shortfall in October 2023 and the 56.8% shortfall in October 2022.
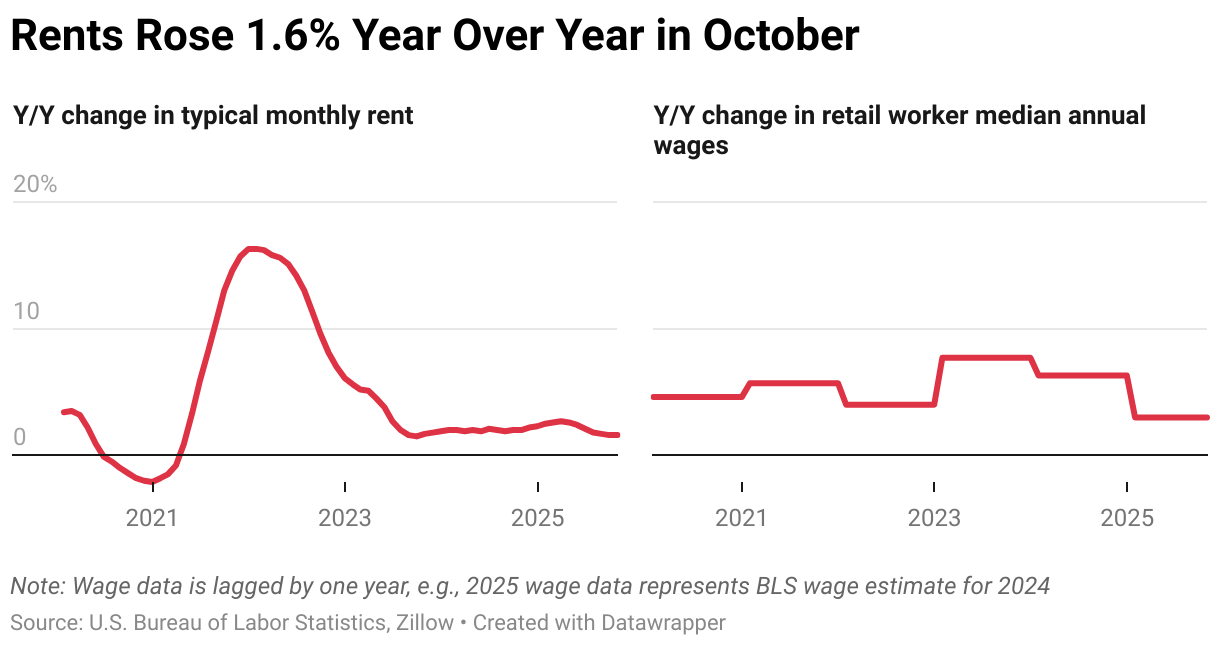
Please note that wage data is lagged by a year; to measure rental affordability for 2025, we use 2025 rent data and 2024 wage data, and to measure rental affordability for 2024, we use 2024 rent data and 2023 wage data, and so on.
Affordability has improved slightly because wages have been growing faster than rents. Retail worker wages have been growing at a pace of around 3% year over year, and rents have been growing at a rate closer to 2%. That’s a shift from the pandemic moving frenzy, when rents were growing much faster than wages. Rent growth has slowed because an apartment-construction boom during the pandemic left landlords with rising vacancies, giving them less leeway to raise rents.
Earnings Shortfall Is Smallest for Retail Workers in Cleveland, Largest in New York
The typical retail worker in Cleveland earns 32.9% less than they would need to afford the typical apartment—the smallest shortfall among the metropolitan areas Redfin analyzed. It’s followed by St. Louis (34.6%), San Antonio (35.2%), Kansas City, MO (37.1%) and Milwaukee (37.5%). These are all places with among the lowest rents in the nation.
Redfin analyzed the 50 most populous metro areas and included in this analysis the 40 with sufficient data. In every metro, the typical retail worker earns less than they would need to afford the typical apartment.
In New York, the typical retail worker earns 71% less than they would need to afford the typical apartment—the largest shortfall among the metros Redfin analyzed. Next came Boston (66.5%), San Jose, CA (65.7%), Miami (65.2%) and San Diego (64.6%). These are all places with among the highest rents in the nation.
Metro-Level Summary: Rental Affordability for Retail Workers
Data in the table below covers October 2025, aside from data on retail wages, which represent estimates for the full year of 2024.
| U.S. metro area | Retail worker median annual wages | Annual income needed to afford typical apartment | Ratio of retail worker median annual wages to annual income needed to afford typical apartment | Typical monthly apartment rent |
|---|---|---|---|---|
| Atlanta, GA | $32,211 | $66,565 | 51.6% | $1,664 |
| Austin, TX | $33,466 | $57,645 | 41.9% | $1,441 |
| Baltimore, MD | $34,658 | $71,618 | 51.6% | $1,790 |
| Boston, MA | $38,518 | $114,881 | 66.5% | $2,872 |
| Charlotte, NC | $32,696 | $62,520 | 47.7% | $1,563 |
| Chicago, IL | $36,127 | $78,862 | 54.2% | $1,972 |
| Cincinnati, OH | $31,892 | $54,704 | 41.7% | $1,368 |
| Cleveland, OH | $31,982 | $47,654 | 32.9% | $1,191 |
| Columbus, OH | $32,646 | $56,408 | 42.1% | $1,410 |
| Dallas, TX | $32,968 | $60,504 | 45.5% | $1,513 |
| Denver, CO | $40,278 | $70,909 | 43.2% | $1,773 |
| Detroit, MI | $34,520 | $55,357 | 37.6% | $1,384 |
| Houston, TX | $31,739 | $56,929 | 44.2% | $1,423 |
| Indianapolis, IN | $32,247 | $53,644 | 39.9% | $1,341 |
| Jacksonville, FL | $32,637 | $59,660 | 45.3% | $1,491 |
| Kansas City, MO | $33,643 | $53,458 | 37.1% | $1,336 |
| Las Vegas, NV | $32,522 | $60,490 | 46.2% | $1,512 |
| Los Angeles, CA | $38,090 | $107,037 | 64.4% | $2,676 |
| Miami, FL | $33,740 | $97,010 | 65.2% | $2,425 |
| Milwaukee, WI | $33,572 | $53,736 | 37.5% | $1,343 |
| Minneapolis, MN | $36,984 | $63,569 | 41.8% | $1,589 |
| Nashville, TN | $34,338 | $65,758 | 47.8% | $1,644 |
| New York, NY | $39,185 | $134,896 | 71.0% | $3,372 |
| Orlando, FL | $33,107 | $71,414 | 53.6% | $1,785 |
| Philadelphia, PA | $35,006 | $71,331 | 50.9% | $1,783 |
| Phoenix, AZ | $36,178 | $60,743 | 40.4% | $1,519 |
| Pittsburgh, PA | $31,898 | $55,561 | 42.6% | $1,389 |
| Portland, OR | $38,246 | $67,940 | 43.7% | $1,699 |
| Providence, RI | $37,288 | $81,291 | 54.1% | $2,032 |
| Riverside, CA | $37,073 | $89,943 | 58.8% | $2,249 |
| Sacramento, CA | $38,378 | $78,897 | 51.4% | $1,972 |
| San Antonio, TX | $32,201 | $49,708 | 35.2% | $1,243 |
| San Diego, CA | $38,243 | $108,071 | 64.6% | $2,702 |
| San Francisco, CA | $43,030 | $115,062 | 62.6% | $2,877 |
| San Jose, CA | $44,613 | $130,206 | 65.7% | $3,255 |
| Seattle, WA | $42,532 | $82,645 | 48.5% | $2,066 |
| St. Louis, MO | $33,497 | $51,211 | 34.6% | $1,280 |
| Tampa, FL | $32,422 | $72,053 | 55.0% | $1,801 |
| Virginia Beach, VA | $31,847 | $64,821 | 50.9% | $1,621 |
| Washington, DC | $37,372 | $90,330 | 58.6% | $2,258 |
| National—U.S.A. | $34,436 | $71,172 | 51.6% | $1,779 |