- Pending sales fell 6% in December—the largest seasonally adjusted decline since 2022—amid stubbornly high housing costs and economic uncertainty.
- The typical home that did sell spent 60 days on the market, the slowest December pace in a decade.
- The supply of homes for sale fell the most since 2023 as sellers retreated amid sluggish demand.
- The good news for buyers is mortgage rates have been falling and many sellers are offering concessions—the typical home that sold last month went for roughly 2% less than its list price.
U.S. pending home sales declined 5.9% month over month in December to the lowest seasonally adjusted level on record except April 2020, when the coronavirus pandemic halted the housing market. Redfin’s records date back to 2012.
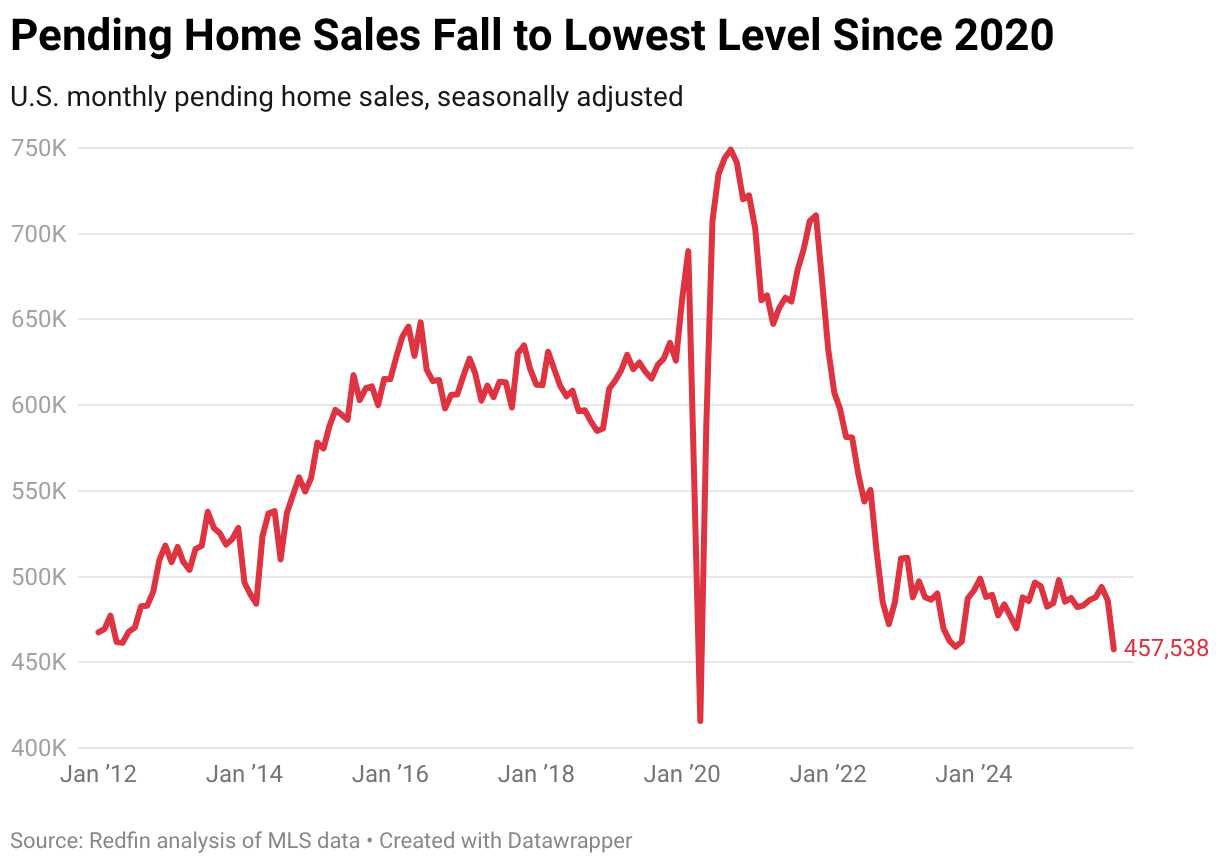
December’s decline was the largest since September 2022. On a year-over-year basis, pending sales fell 7.4%.
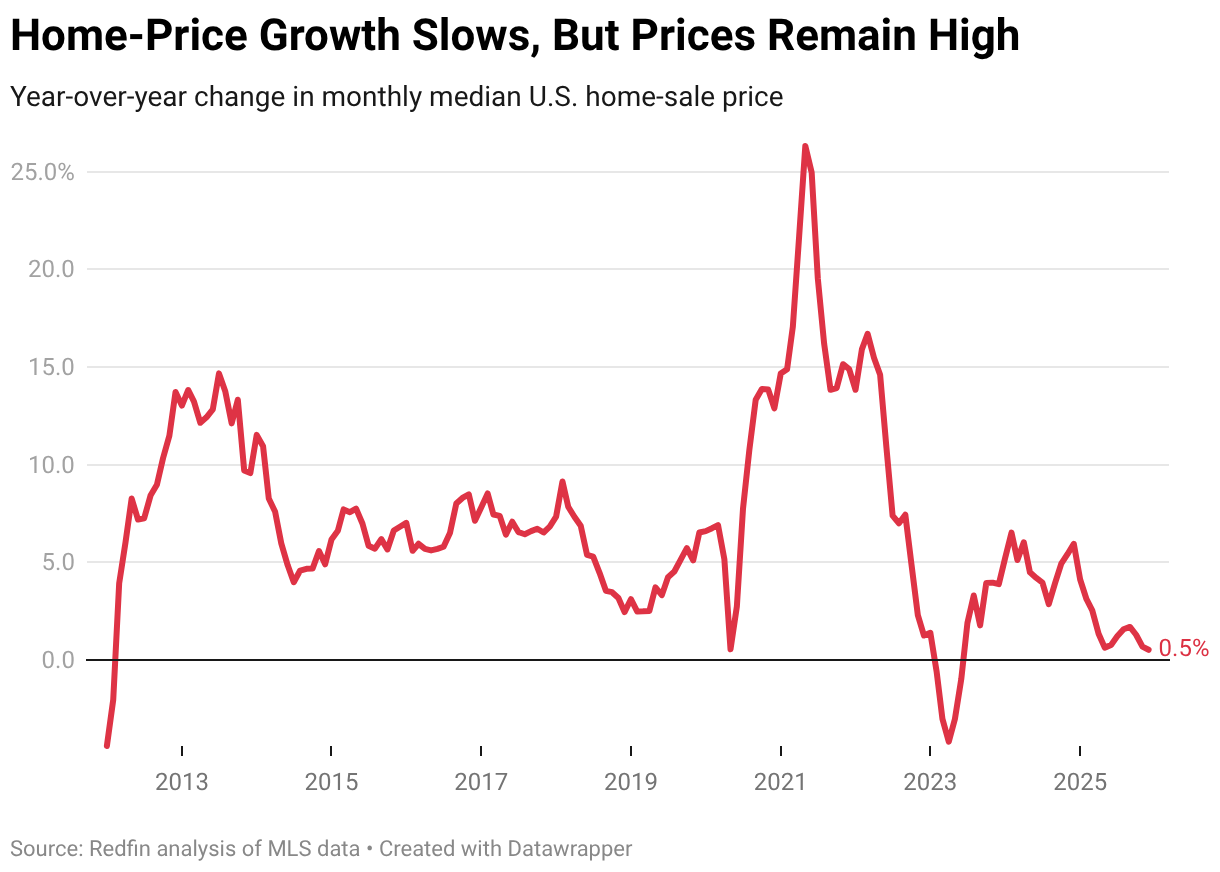
Homebuyers are skittish due to stubbornly high housing costs, layoffs, and mounting economic and political uncertainty. Mortgage rates have come down in recent months but are still above 6%—more than double the all-time low they fell to during the pandemic. Prices are also high. The median home sale price rose 0.5% year over year in December to $428,742—the highest December level on record. While that’s the slowest growth since June 2023, it’s still growth, and many homebuyers are priced out of the market.
It’s worth noting that mortgage rates did briefly dip below 6% last week after President Trump ordered a $200 billion mortgage bond purchase. That led to a jump in mortgage demand, which may boost pending home sales in January.
“Buyers are extremely selective and still think prices are too high,” said Alison Williams, a Redfin Premier real estate agent in Sacramento, CA. “There aren’t a ton of homes on the market, but there are enough for house hunters to feel like they can take their time. One challenge is that many buyers’ purchases are contingent on the sale of their current property, and many sellers aren’t willing to take contingent offers. This has caused a standstill in the market.”
The typical home that went under contract in December spent 60 days on the market. That’s the slowest December pace in a decade and is six days higher than a year earlier.
Some buyers are also getting cold feet at the eleventh hour; roughly 40,000 home purchases were canceled in December, equal to 16.3% of homes that went under contract that month. That’s the highest December share in records dating back to 2017.
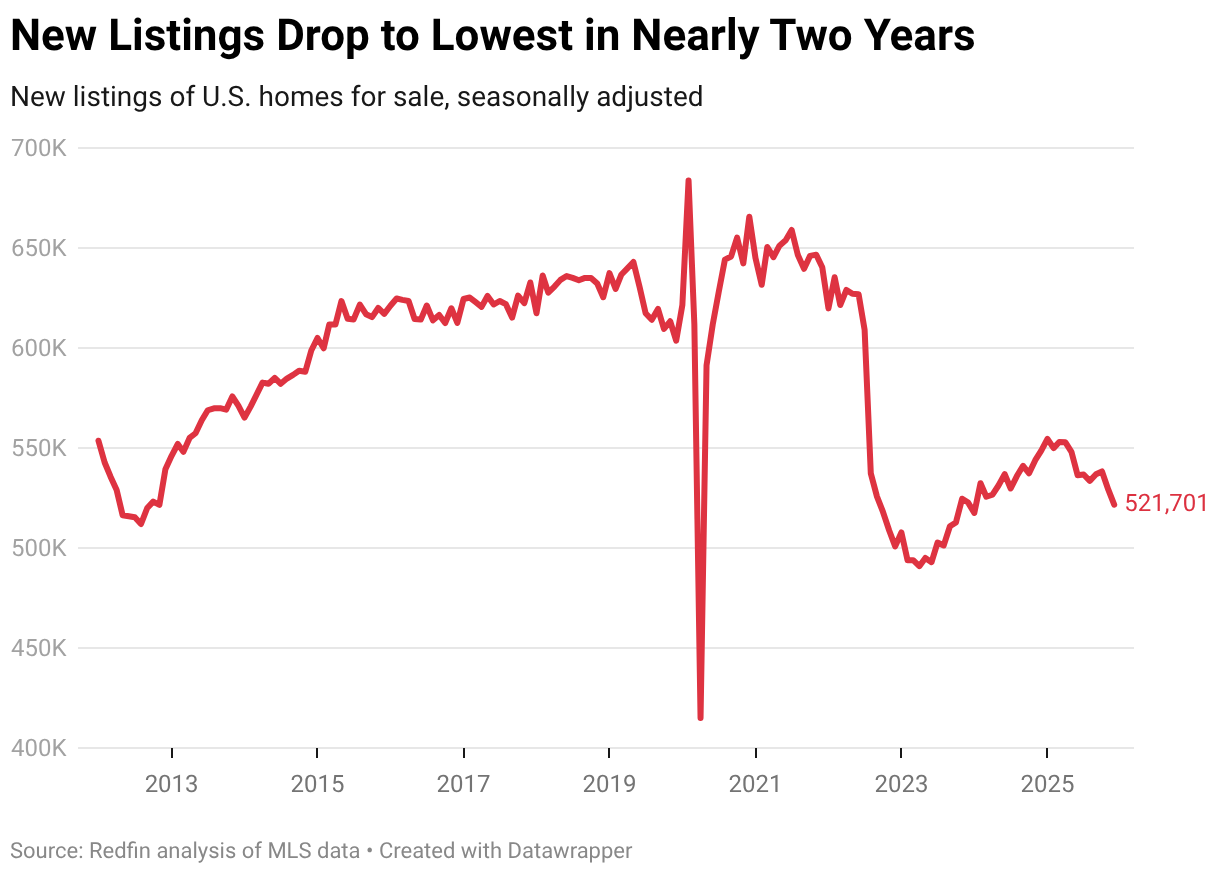
New Listings Drop to Lowest Level in Nearly Two Years
New listings of homes for sale declined 1.4% month over month in December to the lowest seasonally adjusted level since January 2024, and fell 4.9% year over year.
Active listings fell 1.1% month over month—the largest seasonally adjusted decline since June 2023—and rose 3.9% year over year.
Home sellers are retreating because buyers are retreating. Many prospective sellers are also in the market for their next home and may opt not to sell because buying that next home is too expensive.
“Breaking even is a win for home sellers in today’s market. Some sellers who bought in the past five years are finding themselves underwater after accounting for closing costs and commissions,” Williams said. “Buyers see dollar signs if a home is outdated, so sellers should make sure their homes are well maintained and provide a pre-inspection. When sellers follow that advice, they have a better chance of getting their list price and selling their home quickly.”
In many cases, sellers are offering concessions and/or cutting their price to woo buyers. Buyers hold the negotiating power in most markets today because even though sellers have been retreating, there are still far more sellers than buyers.
The typical home that sold in December went for 1.8% less than its final list price, the biggest December discount since 2022. Just 22% of homes sold for more than their final list price—the lowest December share since 2019.
December 2025 Housing Market Highlights: United States
| December 2025 | Month-over-month change | Year-over-year change | |
|---|---|---|---|
| Median sale price | $428,742 | -1.0% | 0.5% |
| Existing-home sales, seasonally adjusted annual rate | 4,290,826 | 0.0% | 0.3% |
| Pending home sales, seasonally adjusted | 457,538 | -5.9% | -7.4% |
| Homes sold, seasonally adjusted | 435,735 | 0.8% | -1.6% |
| New listings, seasonally adjusted | 521,701 | -1.4% | -4.9% |
| Total homes for sale, seasonally adjusted (active listings) | 1,973,715 | -1.1% | 3.9% |
| Months of supply | 2.8 | -1.1 | -0.1 |
| Median days on market | 60 | 7 | 6 |
| Share of homes that sold above final list price | 22.0% | -2.3 ppts | -2.2 ppts |
| Average sale-to-final-list-price ratio | 98.2% | -0.2 ppts | -0.3 ppts |
|
Pending sales that fell out of contract, as % of overall pending sales |
16.3% | 2.0 ppts |
1.4 ppts |
| Monthly average 30-year fixed mortgage rate | 6.19% | -0.05 ppts |
-0.53 ppts |
December 2025 Metro-Level Highlights
The figures below are based on a list of the 50 most populous U.S. metropolitan areas. Some metros may be removed from time to time to ensure data accuracy. Refer to our metrics definition page for explanations of metrics used in this report. Metro-level data are not seasonally adjusted. All changes below represent year-over-year changes.
- Prices: Median sale prices rose most from a year earlier in Detroit (8.9%), Newark, NJ (8%) and St. Louis (7.8%). They fell most in Dallas (-7.6%), Oakland, CA (-5.6%) and Austin, TX (-4.2%).
- Pending home sales: Pending sales rose most in West Palm Beach, FL (11.7%), Riverside, CA (6.7%) and Anaheim, CA (5%). They fell most in San Jose, CA (-34.6%), San Francisco (-18.7%) and Minneapolis (-18.4%).
- Closed home sales: Home sales rose most in West Palm Beach (21.2%), Phoenix (13%) and Montgomery County, PA (12.8%). They fell most in San Jose (-14.5%), Detroit (-9.3%) and Philadelphia (-5.8%).
- New listings: New listings rose most in San Francisco (4.5%), Boston (4.3%) and Montgomery County (3.2%). They fell most in San Antonio (-20.1%), Jacksonville, FL (-19.7%) and Tampa, FL (-17.2%).
- Active listings: Active listings rose most in Boston (17%), Baltimore (16.1%) and Washington, D.C. (15.6%). They fell most in San Francisco (-20.9%), San Jose (-9.4%) and Jacksonville (-9.3%).
- Days on market: In Houston, the typical home that went under contract did so in 79 days, which was 19 days longer than a year earlier—the biggest increase among the metros analyzed. Next came San Antonio (+17 days), followed by Fort Lauderdale and Newark (both +16 days). Four metros saw a decrease in days on market: San Francisco (-8), San Jose (-6), Kansas City, MO (-3) and Milwaukee (-1).
- Sold above list price: In Newark, 54.2% of homes sold above their final list price, the highest share among the metros analyzed. Next came Nassau County, NY (49.5%) and San Jose (46.8%). The lowest shares were in West Palm Beach (5.3%), Miami (6.3%) and Fort Lauderdale (6.4%).
December 2025 Full Metro-Level Data
| U.S. metro area | Median sale price | Median sale price, Y/Y change | Pending sales, Y/Y change | Homes sold, Y/Y change | New listings, Y/Y change | Active listings, Y/Y change | Median days on market | Median days on market, Y/Y change |
|---|---|---|---|---|---|---|---|---|
| Anaheim, CA | $1,165,000 | 1.8% | 5.0% | 2.8% | -5.2% | 3.0% | 55 | 8 |
| Atlanta, GA | $385,000 | -2.3% | -6.4% | -1.2% | -4.3% | 13.4% | 68 | 8 |
| Austin, TX | $431,277 | -4.2% | -5.1% | 3.2% | -11.4% | 6.9% | 106 | 15 |
| Baltimore, MD | $399,900 | 3.9% | -6.5% | -0.2% | -0.9% | 16.1% | 44 | 8 |
| Boston, MA | $725,000 | 0.7% | 0.5% | 3.0% | 4.3% | 17.0% | 29 | 4 |
| Charlotte, NC | $412,000 | 4.3% | N/A | 5.3% | -4.7% | 10.4% | 77 | 13 |
| Chicago, IL | $355,000 | 4.4% | -7.8% | 2.0% | -2.7% | -5.3% | 61 | 0 |
| Cincinnati, OH | $302,342 | 5.4% | -13.6% | 6.8% | -8.7% | 7.8% | 50 | 6 |
| Cleveland, OH | $230,000 | 0.0% | -5.9% | 8.8% | 0.5% | 3.9% | 35 | 1 |
| Columbus, OH | $340,000 | 3.0% | -1.3% | 0.3% | -14.3% | 8.1% | 59 | 7 |
| Dallas, TX | $390,000 | -7.6% | -0.1% | 2.3% | -14.6% | 4.7% | 77 | 11 |
| Denver, CO | $570,000 | -0.9% | -13.7% | -2.3% | -13.4% | 3.5% | 57 | 5 |
| Detroit, MI | $195,000 | 8.9% | -11.0% | -9.3% | -2.9% | 15.4% | 36 | 4 |
| Fort Lauderdale, FL | $450,000 | -0.8% | 2.3% | 4.6% | -12.1% | -2.6% | 99 | 16 |
| Fort Worth, TX | $350,000 | -2.8% | -1.0% | -1.7% | -0.7% | -0.9% | 65 | 0 |
| Houston, TX | $335,000 | 0.0% | -12.0% | -0.9% | -3.3% | 6.0% | 79 | 19 |
| Indianapolis, IN | $310,000 | 1.6% | -6.3% | 4.7% | -12.3% | 9.0% | 39 | 7 |
| Jacksonville, FL | $370,000 | -2.6% | -1.5% | -4.7% | -19.7% | -9.3% | 84 | 7 |
| Kansas City, MO | $337,473 | 3.4% | N/A | 2.8% | 1.5% | -0.8% | 38 | -3 |
| Las Vegas, NV | $445,000 | 1.4% | -4.0% | -1.4% | -6.5% | 14.6% | 72 | 14 |
| Los Angeles, CA | $890,000 | -1.7% | 0.8% | 1.2% | -1.7% | 3.5% | 60 | 9 |
| Miami, FL | $550,000 | -3.5% | 2.5% | -0.3% | -11.4% | 1.2% | 92 | 10 |
| Milwaukee, WI | $335,000 | 4.7% | -5.6% | 0.0% | -7.3% | 1.5% | 48 | -1 |
| Minneapolis, MN | $383,600 | 2.3% | -18.4% | 2.4% | -5.2% | 0.1% | 42 | 0 |
| Montgomery County, PA | $495,000 | 5.5% | 0.6% | 12.8% | 3.2% | 7.1% | 38 | 5 |
| Nashville, TN | $463,000 | 0.7% | 1.5% | 2.2% | 2.2% | 14.6% | 86 | 13 |
| Nassau County, NY | $735,000 | 2.8% | -7.3% | -2.1% | -4.5% | -1.4% | 35 | 3 |
| New Brunswick, NJ | $560,000 | 3.7% | -6.1% | 0.3% | -1.2% | 2.8% | 48 | 6 |
| New York, NY | $780,000 | 5.4% | 2.4% | -0.8% | -6.7% | 3.2% | 60 | 6 |
| Newark, NJ | $610,000 | 8.0% | 4.1% | -2.6% | -1.2% | 14.6% | 44 | 16 |
| Oakland, CA | $850,000 | -5.6% | -17.7% | -1.1% | -16.3% | 3.7% | 35 | 3 |
| Orlando, FL | $400,000 | -1.2% | -5.4% | -4.6% | -11.6% | -1.5% | 63 | 4 |
| Philadelphia, PA | $286,500 | 2.3% | -4.4% | -5.8% | -3.4% | 2.7% | 49 | 4 |
| Phoenix, AZ | $469,500 | 1.0% | 3.1% | 13.0% | -0.9% | 5.8% | 68 | 6 |
| Pittsburgh, PA | $240,000 | 5.3% | 0.9% | 0.2% | 0.7% | 2.9% | 64 | 3 |
| Portland, OR | $545,000 | 1.2% | -8.7% | 7.0% | -9.4% | 4.2% | 55 | 8 |
| Providence, RI | $500,000 | 4.4% | -5.3% | 8.2% | -1.1% | 4.7% | 34 | 3 |
| Riverside, CA | $585,000 | 0.0% | 6.7% | 1.7% | -5.8% | -2.2% | 61 | 7 |
| Sacramento, CA | $565,000 | -3.4% | -3.0% | 3.3% | 0.9% | 5.8% | 51 | 13 |
| San Antonio, TX | $310,000 | -1.6% | 1.1% | 1.0% | -20.1% | 0.8% | 99 | 17 |
| San Diego, CA | $900,000 | 2.3% | 2.5% | 2.6% | 3.0% | 4.9% | 42 | 5 |
| San Francisco, CA | $1,450,000 | 3.6% | -18.7% | 11.7% | 4.5% | -20.9% | 32 | -8 |
| San Jose, CA | $1,430,000 | -3.9% | -34.6% | -14.5% | -2.9% | -9.4% | 25 | -6 |
| Seattle, WA | $790,000 | 0.0% | -8.3% | 1.3% | -10.9% | 15.3% | 41 | 12 |
| St. Louis, MO | $275,000 | 7.8% | N/A | 1.8% | -0.5% | 7.8% | 34 | 0 |
| Tampa, FL | $385,000 | 1.3% | -14.5% | -3.7% | -17.2% | -0.7% | 63 | 7 |
| Virginia Beach, VA | $367,100 | 3.4% | 2.0% | 11.6% | -8.3% | 4.9% | 43 | 6 |
| Warren, MI | $318,000 | 6.0% | -15.2% | -3.8% | -3.4% | 8.5% | 35 | 5 |
| Washington, DC | $575,000 | 4.6% | -2.5% | -5.8% | -2.0% | 15.6% | 55 | 13 |
| West Palm Beach, FL | $509,500 | 1.9% | 11.7% | 21.2% | -8.9% | -5.7% | 87 | 6 |