- Luxury pending home sales in West Palm Beach posted a larger gain than any other major metro in January, rising almost six times faster than non luxury sales.
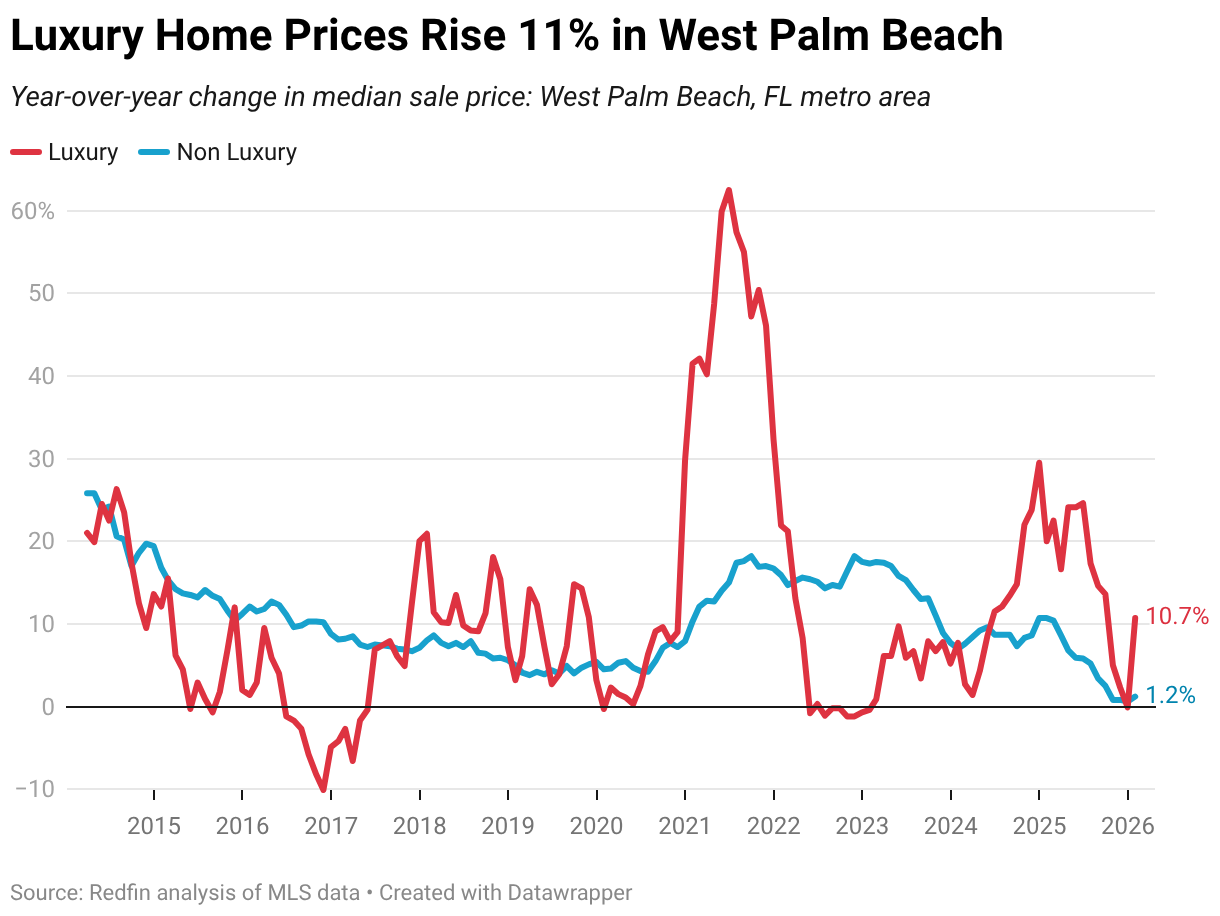
- Luxury prices jumped 11%—more than double the national gain.
- West Palm Beach, which some call “Wall Street South,” has seen its luxury market skyrocket due to an influx of finance firms and wealthy out-of-towners.
Luxury pending home sales rose 30% year over year in West Palm Beach, FL in January—the biggest increase among the 50 most populous U.S. metropolitan areas. That’s just shy of the 31.5% gain in luxury pending sales that West Palm Beach saw the month before, which was the biggest since June 2021.
Luxury pending sales in West Palm Beach rose nearly six times faster than non luxury pending sales, which posted a 5.2% year-over-year increase.
West Palm Beach bucked the national trend; U.S. luxury pending sales fell 3.6% from a year earlier in January, and U.S. non luxury pending sales declined 1.8%.
This is based on a Redfin analysis of MLS home sales from November 2025 through January 2026, which we refer to as “January” throughout this report. All figures cover rolling three-month periods. Redfin defines luxury homes as those estimated to be in the top 5% of their metro area’s price range, while non-luxury homes fall into the 35th–65th percentile. These data are subject to revision.
West Palm Beach also saw a large uptick in luxury prices. The median sale price of luxury homes in the metro jumped 10.7% year over year to $4.2 million, compared with a 1.2% uptick in non luxury prices. The uptick in luxury prices was more than double the national gain; U.S. luxury home prices rose 4.4% and U.S. non luxury prices increased 1.4%.
West Palm Beach is the sixth most expensive major metro to buy a luxury home, surpassed only by four California metros and Miami. Redfin reported late last year that West Palm Beach luxury home prices have soared 187% over the past decade—more than any other major metro.
The area’s luxury housing market has boomed due to an influx of wealthy buyers relocating from states like New York and California in search of lower taxes and sunny weather. West Palm Beach has evolved into a financial hub dubbed “Wall Street South,” attracting hedge funds, private equity firms and finance executives whose presence has boosted local luxury demand. At the same time, waterfront estates and premier properties remain relatively scarce, keeping supply tight and prices elevated.
New listings of luxury homes for sale in West Palm Beach fell 4.3% year over year in January and new listings of non luxury homes dropped 12.2%. By comparison, luxury new listings nationwide fell just 3.1% and non luxury new listings nationwide declined 5.1%.
“This winter has been so brutal up north that everyone has been coming to West Palm Beach for vacation and wondering whether they should move here. We’re walking around in shorts playing golf while everyone else is shoveling snow,” said local Redfin Premier real estate agent Elena Fleck. “West Palm Beach has become so popular that a $1 million home is no longer considered high end. In a lot of U.S. cities, homes under $500,000 are the most sought after, but in West Palm Beach, homes over $1 million are a hot commodity because we have so many wealthy cash buyers coming in from out of state.”
Fleck added that West Palm Beach could see an even larger uptick in sales if Gov. Ron DeSantis’s plan to slash property taxes for primary homeowners goes into effect.
January 2026 Luxury Market Summary: West Palm Beach vs United States
| West Palm Beach | U.S.A. | |
|---|---|---|
| Median sale price | $4,243,867 | $1,340,114 |
| Median sale price, YoY change | 10.7% | 4.4% |
| Pending home sales, YoY change | 30.0% | -3.6% |
| Homes sold, YoY change | 11.2% | -3.2% |
| New listings, YoY change | -4.3% | -3.1% |
| Active listings, YoY change | 0.0% | 4.0% |
| Median days on market | 99 | 69 |
| Median days on market, YoY change | 26 | 3 |
Other Metro-Level Luxury Highlights: January 2026
Redfin’s metro-level luxury data includes the 50 most populous U.S. metros. All changes below are year over year.
- Prices: Luxury prices rose most in Kansas City, MO (17.1%), Nashville (16.4%) and San Francisco (15.8%). They fell in just three metros: Fort Worth, TX (-2.1%), Denver (-1.3%) and Portland, OR (-0.2%).
- Pending sales: Luxury pending sales rose most in West Palm Beach (30%), Tampa, FL (24.7%) and Portland (20%). They fell most in San Jose, CA (-29.8%), Minneapolis (-24.8%) and Nassau County, NY (-23.4%).
- Closed home sales: Luxury home sales rose most in Tampa (41.5%), San Francisco (25.8%) and Virginia Beach, VA (21.7%). They fell most in San Jose (-32.4%), Milwaukee (-17.9%) and Los Angeles (-15.8%).
- New listings: Luxury new listings rose most in Detroit (39.7%), St. Louis (25.1%) and Atlanta (23.9%). They fell most in New York (-29.1%), Milwaukee (-25.3%) and Los Angeles (-22.5%).
- Active listings: Luxury active listings rose most in Tampa (36.8%), Detroit (26.5%) and Atlanta (19%). They fell most in San Jose (-26.7%), San Francisco (-20.6%) and Philadelphia (-16.7%).
- Median days on market: Luxury homes sold fastest in San Jose (19 days), Oakland, CA (21) and St. Louis (24). They sold slowest in Miami (140), Fort Lauderdale, FL (138) and San Antonio (113).
Full Metro-Level Luxury Data: January 2026
The table below includes the 50 most populous U.S. metropolitan areas. Luxury homes are defined as those estimated to be in the top 5% of their respective metro area based on prices of homes sold over a rolling 12-month period.
| U.S. metro area | Median sale price | Median sale price, YoY change | Pending sales, YoY change | Homes sold, YoY change | New listings, YoY change | Active listings, YoY change | Median days on market | Median days on market,YoY change |
|---|---|---|---|---|---|---|---|---|
| Anaheim, CA | $5,126,216 | 11.1% | -1.2% | 10.4% | -12.7% | -15.0% | 83 | -5 |
| Atlanta, GA | $1,447,519 | 6.5% | -1.8% | -10.9% | 23.9% | 19.0% | 63 | -8 |
| Austin, TX | $1,800,000 | 6.6% | -9.0% | -1.3% | -8.1% | -7.5% | 93 | -27 |
| Baltimore, MD | $1,329,323 | 9.0% | -3.8% | -8.0% | -5.0% | 7.6% | 57 | 13 |
| Boston, MA | $2,842,292 | 9.3% | -7.8% | -15.6% | -8.9% | -0.3% | 55 | 5 |
| Charlotte, NC | $1,644,048 | 5.3% | -0.8% | -5.3% | 0.5% | 10.6% | 74 | 7 |
| Chicago, IL | $1,517,010 | 6.0% | -7.9% | -11.7% | -6.3% | -14.2% | 69 | -14 |
| Cincinnati, OH | $971,440 | 8.4% | -21.6% | -11.8% | -12.2% | -3.6% | 78 | 9 |
| Cleveland, OH | $811,842 | 0.2% | -14.8% | 7.5% | -9.2% | -7.9% | 45 | -2 |
| Columbus, OH | $987,191 | 7.3% | -5.4% | 7.3% | 10.8% | 7.8% | 60 | -11 |
| Dallas, TX | $1,663,481 | 5.5% | -12.5% | -13.2% | -10.4% | 7.7% | 71 | 18 |
| Denver, CO | $1,936,268 | -1.3% | -5.7% | -12.1% | 5.7% | 4.6% | 52 | -9 |
| Detroit, MI | $708,100 | 4.4% | 8.5% | 0.0% | 39.7% | 26.5% | 28 | -10 |
| Fort Lauderdale, FL | $2,271,934 | 7.9% | 10.7% | 10.0% | -7.0% | 2.4% | 138 | 24 |
| Fort Worth, TX | $1,199,442 | -2.1% | 4.1% | -12.8% | -4.1% | 10.3% | 65 | -6 |
| Houston, TX | $1,378,792 | 5.3% | -3.4% | -2.3% | -2.5% | 4.5% | 55 | 11 |
| Indianapolis, IN | $1,007,363 | 10.5% | -2.9% | -3.3% | -4.9% | 3.7% | 43 | 14 |
| Jacksonville, FL | $1,550,720 | 0.9% | -1.4% | -2.7% | -16.1% | -7.1% | 97 | 12 |
| Kansas City, MO | $1,145,528 | 17.1% | -6.6% | -1.9% | 3.7% | -4.3% | 46 | -11 |
| Las Vegas, NV | $1,642,174 | 10.2% | -0.9% | -1.9% | -7.0% | 9.8% | 89 | 14 |
| Los Angeles, CA | $4,494,644 | 8.3% | -18.6% | -15.8% | -22.5% | -5.2% | 79 | -5 |
| Miami, FL | $4,525,304 | 12.6% | 5.3% | -2.6% | -11.4% | -10.5% | 140 | -11 |
| Milwaukee, WI | $1,123,255 | 14.3% | -11.3% | -17.9% | -25.3% | -16.0% | 66 | 7 |
| Minneapolis, MN | $1,215,576 | 6.1% | -24.8% | -2.8% | -12.7% | -2.3% | 52 | -7 |
| Montgomery County, PA | $1,613,181 | 4.8% | 3.3% | -8.2% | -4.6% | -3.2% | 40 | -17 |
| Nashville, TN | $2,285,296 | 16.4% | 13.5% | 5.6% | -0.2% | 17.6% | 106 | 6 |
| Nassau County, NY | $2,725,895 | 7.8% | -23.4% | -0.6% | -7.4% | -12.4% | 78 | -7 |
| New Brunswick, NJ | $2,158,417 | 12.6% | -20.5% | -13.2% | -3.2% | -5.7% | 51 | 1 |
| New York, NY | $4,180,775 | 8.6% | -12.1% | -7.8% | -29.1% | -8.1% | 100 | 26 |
| Newark, NJ | $2,050,681 | 5.7% | -21.1% | -5.8% | 5.8% | -9.8% | 31 | 9 |
| Oakland, CA | $3,139,757 | 8.7% | -11.8% | 13.3% | -8.6% | -9.1% | 21 | -6 |
| Orlando, FL | $1,495,928 | 12.9% | -16.1% | -7.0% | -10.1% | -6.0% | 63 | 3 |
| Philadelphia, PA | $1,335,275 | 12.1% | -17.3% | -11.4% | -19.1% | -16.7% | 55 | -4 |
| Phoenix, AZ | $2,158,131 | 8.7% | 6.5% | 5.8% | 4.6% | 6.8% | 77 | 10 |
| Pittsburgh, PA | $889,792 | 0.5% | 17.3% | 0.0% | 16.1% | 5.0% | 81 | 2 |
| Portland, OR | $1,446,148 | -0.2% | 20.0% | -4.5% | 4.4% | 6.2% | 90 | 10 |
| Providence, RI | $1,632,827 | 0.4% | -16.5% | -7.7% | -16.4% | 5.0% | 60 | 8 |
| Riverside, CA | $1,776,350 | 9.9% | -9.5% | -10.0% | -12.0% | -7.7% | 66 | 4 |
| Sacramento, CA | $1,786,847 | 4.4% | -17.8% | -11.9% | -7.7% | 0.4% | 85 | 18 |
| San Antonio, TX | $976,584 | 5.8% | -0.7% | -7.8% | -8.7% | 5.3% | 113 | 5 |
| San Diego, CA | $3,860,060 | 7.8% | 6.8% | -2.0% | -15.3% | -1.2% | 60 | -8 |
| San Francisco, CA | $7,406,838 | 15.8% | 2.3% | 25.8% | 5.8% | -20.6% | 31 | -6 |
| San Jose, CA | $5,630,424 | 8.3% | -29.8% | -32.4% | 0.0% | -26.7% | 19 | 0 |
| Seattle, WA | $3,076,594 | 3.7% | -16.6% | -10.8% | -14.0% | 1.8% | 35 | 13 |
| St. Louis, MO | $957,008 | 3.5% | -6.3% | -2.2% | 25.1% | 8.9% | 24 | -11 |
| Tampa, FL | $1,524,243 | 7.1% | 24.7% | 41.5% | 20.9% | 36.8% | 32 | -13 |
| Virginia Beach, VA | $1,073,537 | 7.7% | 9.6% | 21.7% | -9.5% | -2.9% | 62 | 18 |
| Warren, MI | $1,089,111 | 11.3% | -20.8% | -2.5% | -15.1% | -3.5% | 47 | 5 |
| Washington, DC | $2,094,882 | 6.3% | -17.7% | -11.9% | -8.8% | 3.3% | 58 | 2 |
| West Palm Beach, FL | $4,243,867 | 10.7% | 30.0% | 11.2% | -4.3% | 0.0% | 99 | 26 |
| National—U.S.A. | $1,340,114 | 4.4% | -3.6% | -3.2% | -3.1% | 4.0% | 69 | 3 |