- 35 of the 50 most populous U.S. metros were buyer’s markets in May, led by places in the Sun Belt.
- There are nearly half a million more home sellers than buyers in the U.S. housing market–46.9% more–signaling that buyers hold the power.
- The number of sellers entering the market is at a 6-year high. Meanwhile, homebuying demand remained flat, which widened the gap slightly.
- There were only 7 seller’s markets. Long Island was the strongest, followed by several other Northeastern metro areas and San Francisco.
- The remaining 8 were balanced markets, including New York, Boston, Minneapolis and other Midwest and East Coast metros.
Homebuyers hold the power in the U.S. housing market. There were an estimated 46.9% more home sellers than buyers in the U.S. housing market in May, up from 46.4% the month before but down from a peak of 49.5% in December 2025.
Nashville, TN, Miami and Austin, TX are the biggest drivers of this spring’s buyer’s market, with the biggest surplus of sellers over buyers. Two more Texas metros, Houston and San Antonio, round out the top five. See the next section of this report for more on those places.
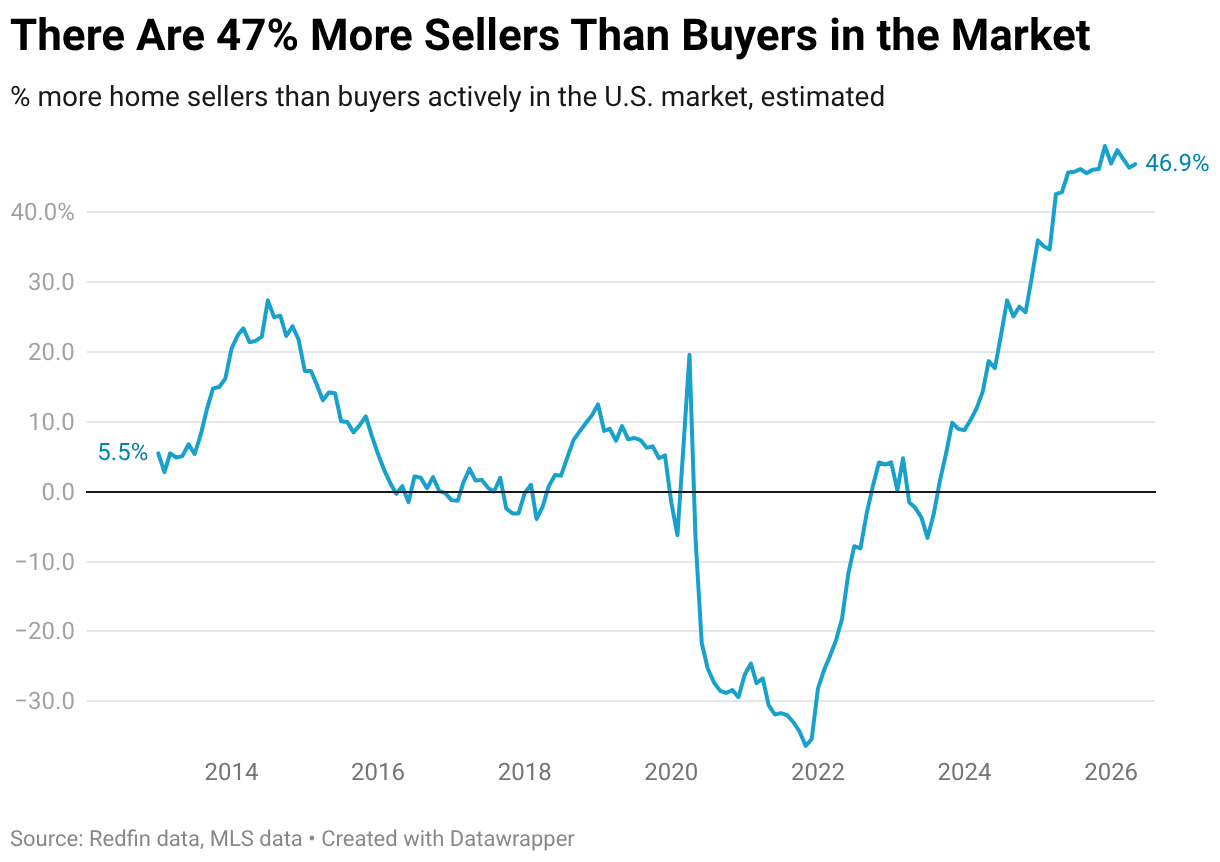
When sellers outnumber buyers, buyers typically have more negotiating power because they have options. That’s why a market with a lot more sellers than buyers is considered a buyer’s market. We define a market where there are over 10% more sellers than buyers as a buyer’s market and a market where there are over 10% fewer sellers than buyers as a seller’s market. A market where the gap is plus or minus 10% is considered a balanced market.
We estimated the number of buyers using proprietary Redfin data on the typical time from a buyer’s first tour to close of purchase, and MLS data on active listings and pending sales. The estimated number of sellers in the market is simply the number of active listings in the MLS. These estimates are seasonally adjusted and subject to revision. See a more detailed methodology here and view an interactive dashboard here.
It’s important to note that it’s only a buyer’s market for people who can afford to buy. High housing costs and widespread economic uncertainty have caused many would-be buyers to back off in recent years, creating the imbalance of buyers and sellers we see today.
“While the gap between homebuyers and sellers has narrowed slightly since the end of last year, house hunters still have far more negotiating power and less pressure to make rushed decisions,” said Redfin Senior Economist Asad Khan. “With lots of inventory to choose from, buyers in most of the country can be selective and ask for concessions, while sellers still need to price competitively to stand out. Still, buyers should remember that it’s not quite as strong of a buyer’s market as it once was. The most desirable homes in popular metro areas–and popular neighborhoods in all areas–are still attracting multiple offers.”
Nashville, Along With Florida and Texas Metros, Are the Biggest Buyer’s Markets
Nearly three-quarters of U.S. housing markets—35 of the 49 U.S. metro areas Redfin analyzed—are buyer’s markets. For this report, Redfin analyzed the 50 most populous metros, and excluded Fort Lauderdale, FL due to insufficient data.
May’s strongest buyer’s market was Nashville, TN, which had an estimated 130% more sellers than buyers. Next came Miami (122%), Austin, TX (116%), Houston (111%) and San Antonio (108%).
“Listings are skyrocketing and buyers are being picky,” said Aaron Glicken, a Redfin Premier agent in Nashville, TN. “Sellers are still struggling to wrap their minds around lower prices, which is one reason so many listings are going stale: Many sellers won’t negotiate or lower their prices. At the same time, buyers are being very particular; they’re contending with high mortgage rates, more choices, and often only want to close a deal if sellers will negotiate.”
The story of Nashville’s market is emblematic of why the Sun Belt is home to so many strong buyer’s markets. The Sun Belt skyrocketed in popularity during the pandemic, when many out-of-staters moved in thanks to remote work and record-low mortgage rates. Home construction boomed to keep pace with demand–but after those new homes were complete, soaring mortgage rates, rising insurance costs, increasing HOA fees and climate risks have limited buyer demand. That has left sellers with more competition.
New construction plays a big role in whether buyers or sellers have the upper hand because it increases housing supply. The South and West–especially Florida and Texas–have built far more homes than the Northeast and Midwest, helping tip many metros in those regions toward buyers.
More Sellers Entered the U.S. Market, While Buying Demand Was Flat
Nationwide, there were an estimated 1,483,839 home sellers in the market in May–the highest level since 2020 and up 0.4% month over month.
Meanwhile, there were an estimated 1,010,386 buyers in the market, essentially unchanged (0.1%) from the month before.
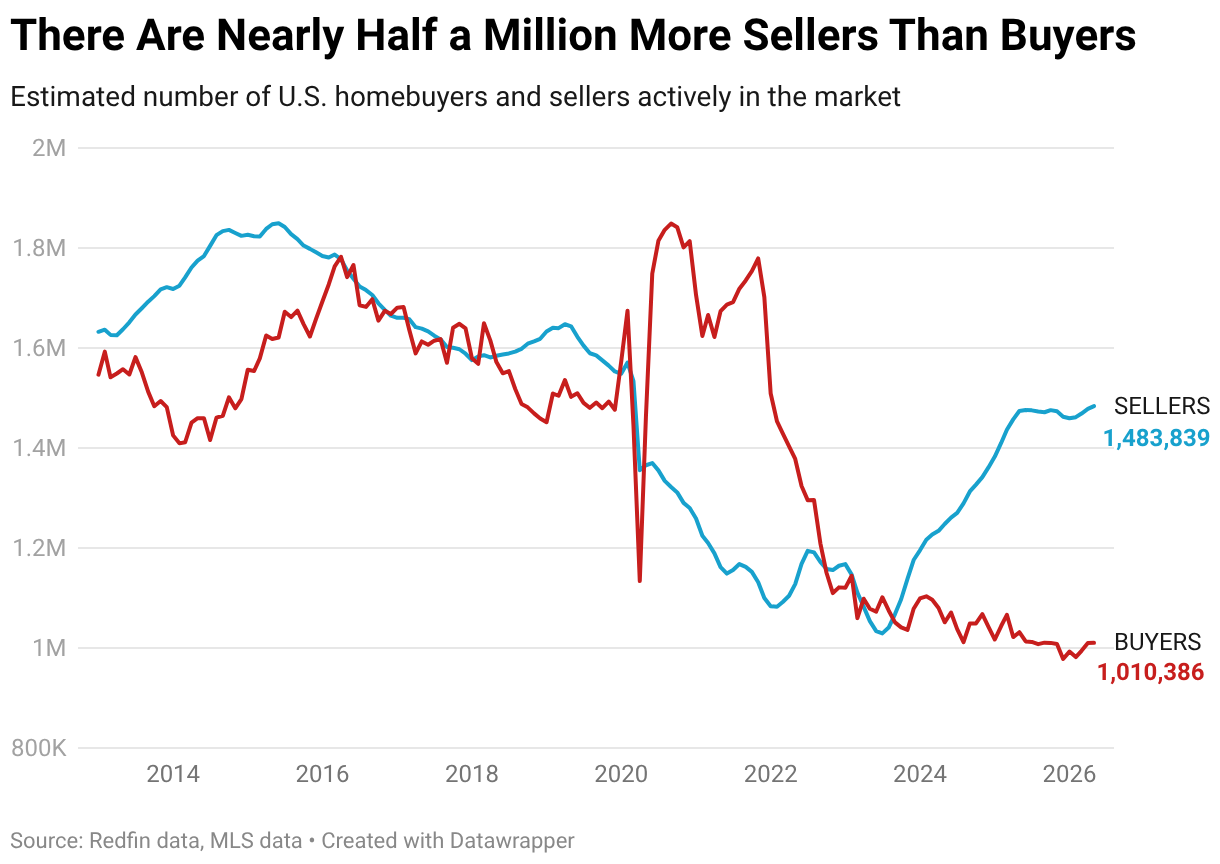
The fact that the number of sellers grew from April to May while the number of buyers was essentially flat explains why the seller surplus ticked up. New listings hit the market at a slightly faster rate than buyers entered the market, increasing competition among sellers a bit from the month before.
Homebuying demand flattened in May largely because mortgage rates soared to their highest level in nearly a year, straining affordability. Widespread economic and geopolitical uncertainty also deterred house hunters, with the Iran war, rising gas prices and inflation coming together to create financial jitters.
More sellers entered the market last month partly because they noticed the uptick in homebuying demand in April, which was due to a strong job market and temporarily lower mortgage rates. As noted above, house-hunting activity has since slowed down.
There Are 7 Seller’s Markets, Led By Long Island
Seven of the major U.S. metro areas Redfin analyzed were seller’s markets in May, tied with April for the highest number in nine months. The metros that are neither seller’s nor buyer’s markets are considered “balanced” markets.
Nassau County, NY was the strongest seller’s market, with 38% fewer sellers than buyers. The other six seller’s markets were Milwaukee (-29.%), Montgomery County, PA (-25%), Newark, NJ (-21%), New Brunswick, NJ (-20%), Providence, RI (-19%) and San Francisco (-14%).
The strongest seller’s markets are in places where construction of new homes has been constrained for years, and which have steady homebuying demand because they’re close to major job centers. San Francisco is a special case: Sellers hold the power there because the local housing market is hot due to the AI boom.
Home-sale prices rose 4.3% year over year, on average, across the seven seller’s markets in May. That’s compared with a 1.6% increase across the 36 buyer’s markets—an indication that in seller’s markets, competition among buyers is pushing up home prices.
House Hunters’ Negotiating Power Grew in 23 of the 35 Buyer’s Markets
Most of the buyer’s markets became stronger buyer’s markets in May. The surplus of home sellers over buyers grew month over month in 23 of the 35 buyer’s markets in America.
The surplus increased most in Nashville, which was also the strongest buyer’s market in May. There were 130% more sellers than buyers in Nashville, up from roughly 114% the month before. The next-biggest monthly increase was in St. Louis, which went from being a balanced market in April to a buyer’s market in May, with 15% more sellers than buyers. Oakland, CA, rounds out the top three (31% more sellers than buyers, up from 21%).
Next are two Texas metros: In both Houstin and Austin, there were more than twice as many sellers as buyers in May, and both metros saw the gap increase nearly 10 percentage points month over month.
In some of the buyer’s markets, house hunters lost some negotiating power. In 12 of the 35, the surplus of sellers over buyers fell from April to May. That means they became less strong buyer’s markets.
The biggest decline was in Pittsburgh, where there were 53% more sellers than buyers, down from about 63% the month before. Next is Miami: There were 122% more sellers than buyers in May, but that’s down from a 131% surplus in April. The next-biggest declines were in West Palm Beach, Portland, OR and Fort Worth, TX.
| Metro-Level Summary: 50* Most Populous Metros (May 2026) | ||||
| U.S. metro area | Balance of power | Percent by which sellers outnumber buyers | Buyers | Sellers |
| Anaheim, CA | Buyer’s Market | 37.7% | 5421 | 7462 |
| Atlanta, GA | Buyer’s Market | 70.0% | 22763 | 38704 |
| Austin, TX | Buyer’s Market | 116.0% | 8462 | 18281 |
| Baltimore, MD | Balanced Market | -0.9% | 11003 | 10906 |
| Boston, MA | Balanced Market | -5.2% | 12880 | 12214 |
| Charlotte, NC | Buyer’s Market | 63.1% | 11038 | 18003 |
| Chicago, IL | Balanced Market | 0.6% | 26447 | 26598 |
| Cincinnati, OH | Buyer’s Market | 34.2% | 6738 | 9043 |
| Cleveland, OH | Balanced Market | -0.2% | 7369 | 7358 |
| Columbus, OH | Buyer’s Market | 36.9% | 6851 | 9380 |
| Dallas, TX | Buyer’s Market | 96.7% | 16245 | 31957 |
| Denver, CO | Buyer’s Market | 50.9% | 10683 | 16121 |
| Detroit, MI | Buyer’s Market | 43.7% | 5107 | 7341 |
| Fort Lauderdale, FL | Buyer’s Market | 99.2% | 9322 | 18566 |
| Fort Worth, TX | Buyer’s Market | 60.7% | 8022 | 12890 |
| Houston, TX | Buyer’s Market | 110.8% | 21809 | 45968 |
| Indianapolis, IN | Buyer’s Market | 17.6% | 8229 | 9675 |
| Jacksonville, FL | Buyer’s Market | 74.0% | 7282 | 12672 |
| Kansas City, MO | Balanced Market | 9.2% | 8002 | 8736 |
| Las Vegas, NV | Buyer’s Market | 102.1% | 7136 | 14424 |
| Los Angeles, CA | Buyer’s Market | 55.9% | 14764 | 23011 |
| Miami, FL | Buyer’s Market | 122.3% | 8740 | 19426 |
| Milwaukee, WI | Seller’s Market | -29.1% | 7697 | 5456 |
| Minneapolis, MN | Balanced Market | 8.1% | 13742 | 14858 |
| Montgomery County, PA | Seller’s Market | -24.9% | 7658 | 5753 |
| Nashville, TN | Buyer’s Market | 129.8% | 7614 | 17494 |
| Nassau County, NY | Seller’s Market | -38.3% | 12742 | 7861 |
| New Brunswick, NJ | Seller’s Market | -19.7% | 11895 | 9550 |
| New York, NY | Balanced Market | -0.2% | 29625 | 29572 |
| Newark, NJ | Seller’s Market | -20.6% | 7824 | 6213 |
| Oakland, CA | Buyer’s Market | 30.5% | 4747 | 6194 |
| Orlando, FL | Buyer’s Market | 78.8% | 10345 | 18498 |
| Philadelphia, PA | Buyer’s Market | 40.1% | 6324 | 8858 |
| Phoenix, AZ | Buyer’s Market | 88.4% | 17297 | 32582 |
| Pittsburgh, PA | Buyer’s Market | 53.3% | 6547 | 10039 |
| Portland, OR | Buyer’s Market | 36.5% | 7989 | 10905 |
| Providence, RI | Seller’s Market | -19.1% | 5572 | 4507 |
| Riverside, CA | Buyer’s Market | 71.0% | 11300 | 19321 |
| Sacramento, CA | Buyer’s Market | 32.0% | 5755 | 7597 |
| San Antonio, TX | Buyer’s Market | 107.5% | 9423 | 19552 |
| San Diego, CA | Buyer’s Market | 23.9% | 6705 | 8310 |
| San Francisco, CA | Seller’s Market | -14.4% | 3155 | 2699 |
| San Jose, CA | Buyer’s Market | 25.8% | 2743 | 3451 |
| Seattle, WA | Buyer’s Market | 44.1% | 7672 | 11055 |
| St. Louis, MO | Buyer’s Market | 14.8% | 9492 | 10893 |
| Tampa, FL | Buyer’s Market | 76.9% | 13445 | 23783 |
| Virginia Beach, VA | Balanced Market | 5.0% | 7465 | 7839 |
| Warren, MI | Buyer’s Market | 12.5% | 8551 | 9623 |
| Washington, DC | Buyer’s Market | 22.0% | 16090 | 19635 |
| West Palm Beach, FL | Buyer’s Market | 74.6% | 8946 | 15619 |
*Fort Lauderdale, FL has been removed due to insufficient data.