High housing costs and economic instability are driving would-be buyers away.
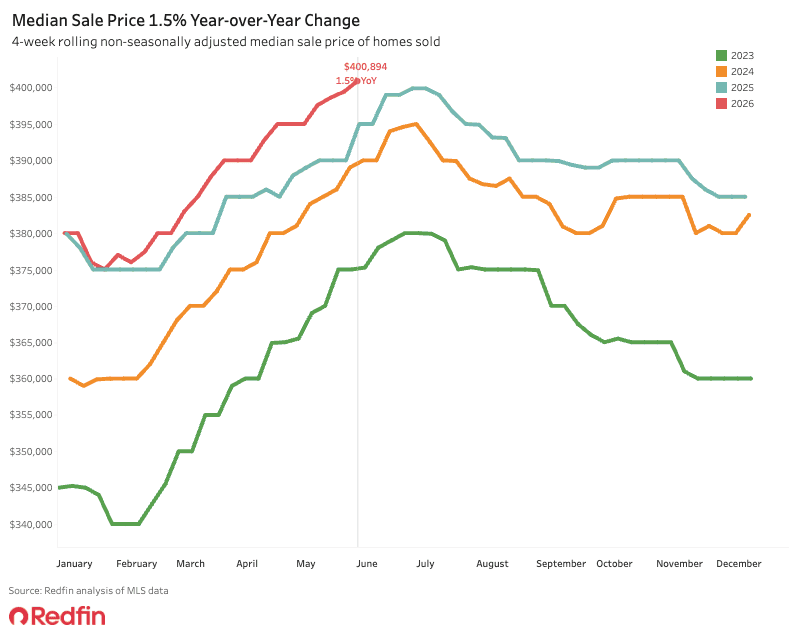
The median U.S. home-sale price hit a record $400,894 during the four weeks ending June 7, up 1.5% year over year. That marks the first time the typical American existing home has sold for over $400,000, according to a Redfin analysis of MLS data.
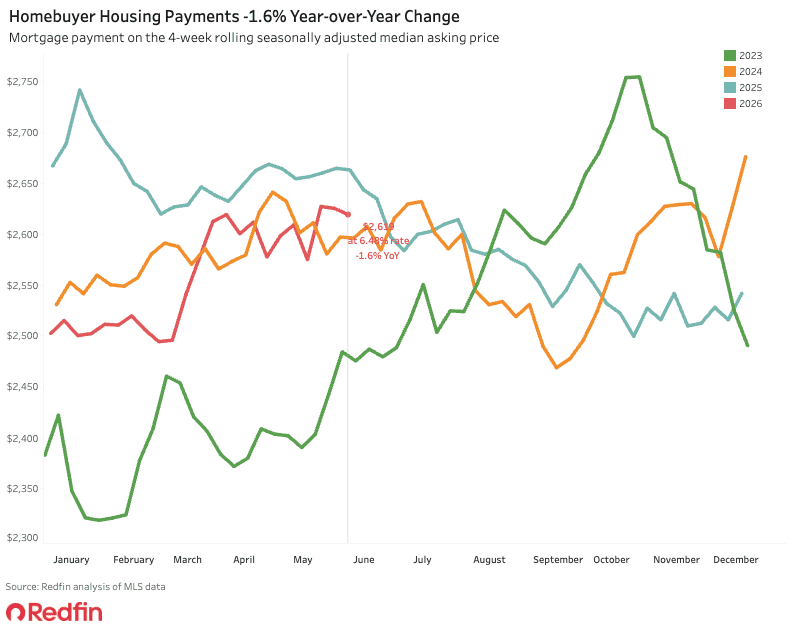
Monthly payments are historically high, too. The typical monthly payment was $2,619, just $8 shy of late May’s 11-month high. Stubbornly high home prices, combined with mortgage rates in the mid-6% range, are propping up monthly housing payments.
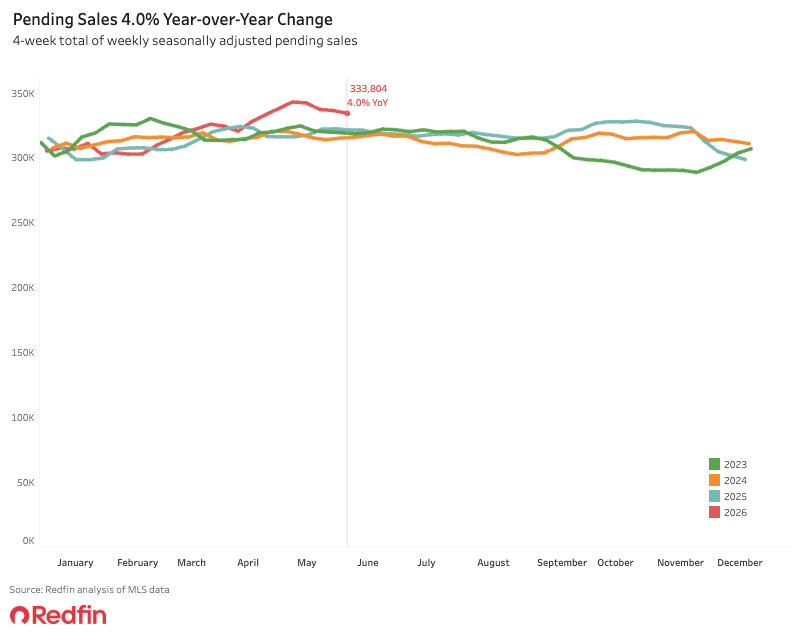
High housing costs are pushing many would-be homebuyers to the sidelines. Pending home sales fell 0.6% from a week earlier, the fourth straight week of declines. Widespread economic uncertainty is also driving prospective buyers away; many Americans are jittery about the Iran war, inflation and the possibility of a Fed rate hike, among other financial ups and downs.
Home prices are rising despite slow homebuying demand. Even though there are more sellers than buyers in the market, new supply is tight enough that prices are staying propped up as some would-be sellers opt to keep their homes off the market as demand slows. The total number of homes for sale was essentially flat week over week, while new listings rose 0.4%. Another reason prices keep rising is that today’s sale prices stem from deals that were negotiated in April and early May, when mortgage rates were lower and demand was a bit stronger.
“Crossing the $400,000 threshold is a reminder of how difficult it is to break into homeownership for many Americans–and rising prices of other things is making it even harder,” said Chen Zhao, Redfin’s head of economics research. “There are a few bright spots, though. Price growth has lost some steam over the last month, and prices aren’t rising nearly as fast as they were last year. And the high costs of purchasing a home are keeping many buyers out of the market, which has led to a historic buyer’s market in most of the country. So even though prices are high, in many markets–especially places like Nashville and Austin, which were once red hot–the door is open for buyers to negotiate with sellers, ask for concessions and get the terms they want.”
For Redfin economists’ takes on the housing market, please visit Redfin’s “From Our Economists” page.
Leading indicators
| Indicators of homebuying demand and activity | ||||
| Value (if applicable) | Recent change | Year-over-year change | Source | |
| Daily average 30-year fixed mortgage rate | 6.67% (June 10) | Up from 6.57% a week earlier | Down from 6.95% | Mortgage News Daily |
| Weekly average 30-year fixed mortgage rate | 6.48% (week ending June 4) | Down from 6.53% a week earlier | Down from 6.85% | Freddie Mac |
| Mortgage-purchase applications (seasonally adjusted) | Up 7% from a week earlier (as of week ending June 5) | Up 4% | Mortgage Bankers Association | |
| Google searches of “homes for sale” | Highest level since July 2025 (as of June 4) | Up more than 20% | Google Trends | |
| Touring activity | Up 26% from the start of the year (as of June 4) | At this time last year, it was up 40% from the start of 2025 | ShowingTime | |
Key housing-market data
| U.S. highlights: Four weeks ending June 7, 2026
Redfin’s national metrics include data from 900+ U.S. metro areas and are based on homes listed and/or sold during the period. Weekly housing-market data goes back through 2021. Subject to revision. |
|||
| Four weeks ending June 7, 2026 | Year-over-year change | Notes | |
| Median sale price | $400,894 | 1.5% | |
| Median asking price (seasonally adjusted) | $402,664 | 1.3% | |
| Median monthly mortgage payment (seasonally adjusted) | $2,619 at a 6.48% mortgage rate | -1.6% | |
| Pending sales (seasonally adjusted) | 338,804 | 4% | |
| New listings (seasonally adjusted) | 364,759 | 1.1% | |
| Active listings (seasonally adjusted) | 1,488,214 | 0.5% | |
| Months of supply | 3.3 | -0.2 pts. | 4 to 5 months of supply is considered balanced, with a lower number indicating seller’s market conditions |
| Share of homes off market in two weeks | 37.7% | Essentially unchanged | |
| Median days on market | 39 | +1 day | |
| Share of home listings with price drops | 19.4% | Down from about 21% | |
| Share of homes sold above list price | 28.2% | Down from 29% | |
| Average sale-to-list price ratio | 99% | Down slightly | |
|
Metro-level highlights: Four weeks ending June 7, 2026 Redfin’s metro-level data includes the 50 most populous U.S. metros. Select metros may be excluded from time to time to ensure data accuracy. |
|||
|---|---|---|---|
| Metros with biggest year-over-year increases | Metros with biggest year-over-year decreases |
Notes |
|
| Median sale price | San Francisco (11.1%)
Pittsburgh (9%) Newark, NJ (7.6%) Nassau County, NY (6.7%) St. Louis (6.6%) |
San Antonio (-3.4%)
San Jose, CA (-2.8%) Orlando, FL (-1.5%) Portland, OR (-1.1%) Seattle (-0.9%) |
Declined in 8 metros |
| Pending sales | West Palm Beach, FL (28.8%)
San Francisco (28.8%) Milwaukee (14.6%) Austin, TX (12.9%) Boston (11.8%) |
Houston (-12.8%)
Seattle (-12%) Denver (-5.1%) Atlanta (-4%) Tampa, FL (-3.2%) |
|
| New listings | Baltimore (11%)
Philadelphia (10.8%) Montgomery County, PA (10.7%) Boston (10.4%) Chicago (8.9%) |
Dallas (-12.4%)
St. Louis (-12.3%) Riverside, CA (-11.6%) Nassau County, NY (-7.4%) Tampa, FL (-6.5%) |
|
Refer to our metrics definition page for explanations of all the metrics used in this report.