The homebuyers who remain in the market have more choices, less competition and more negotiating power.
Here’s what you need to know about the U.S. housing market for the four weeks ending September 13:
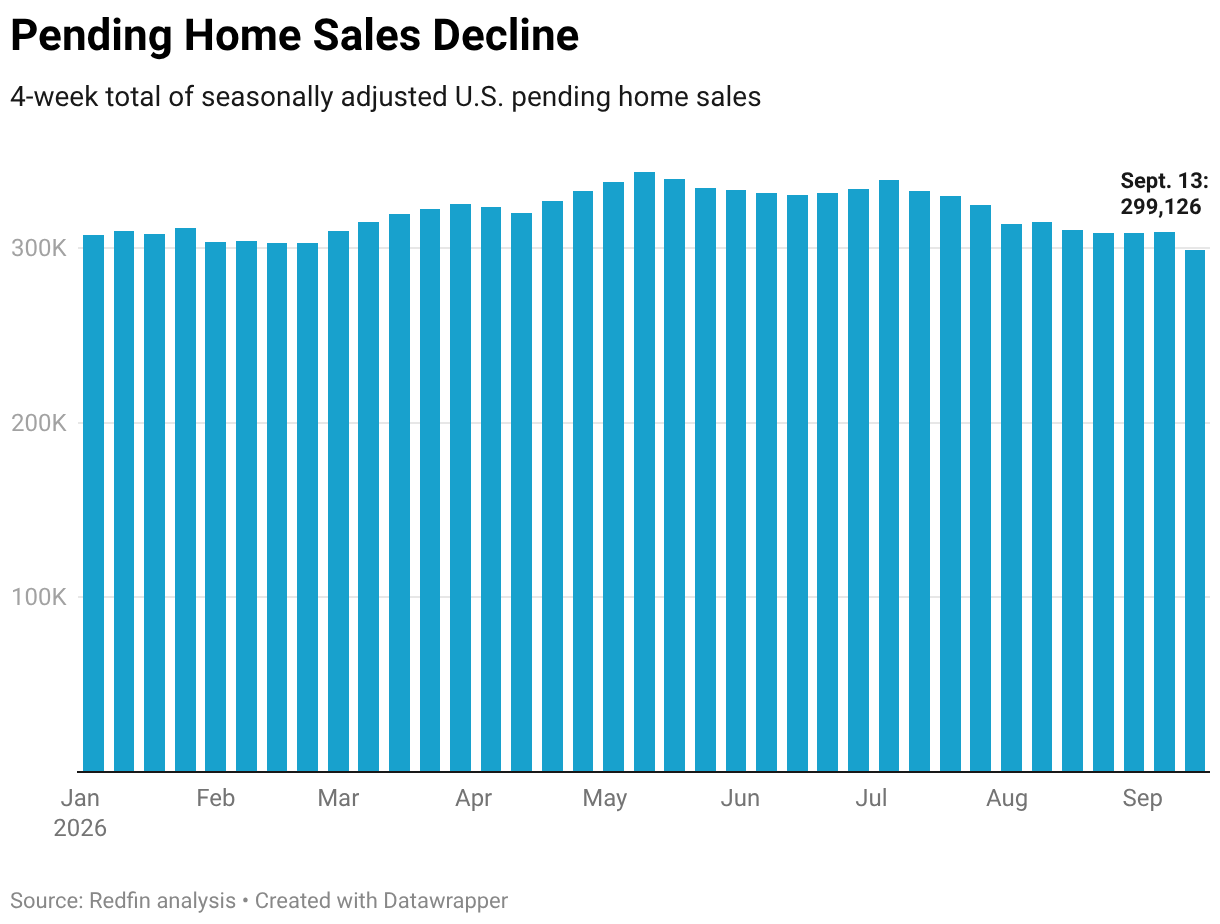
- Buyers have more breathing room than they’ve had in years. Pending home sales fell 3.5% from a week earlier to their lowest level in nearly three years. That means less competition and more room to negotiate for the house hunters who are still shopping.
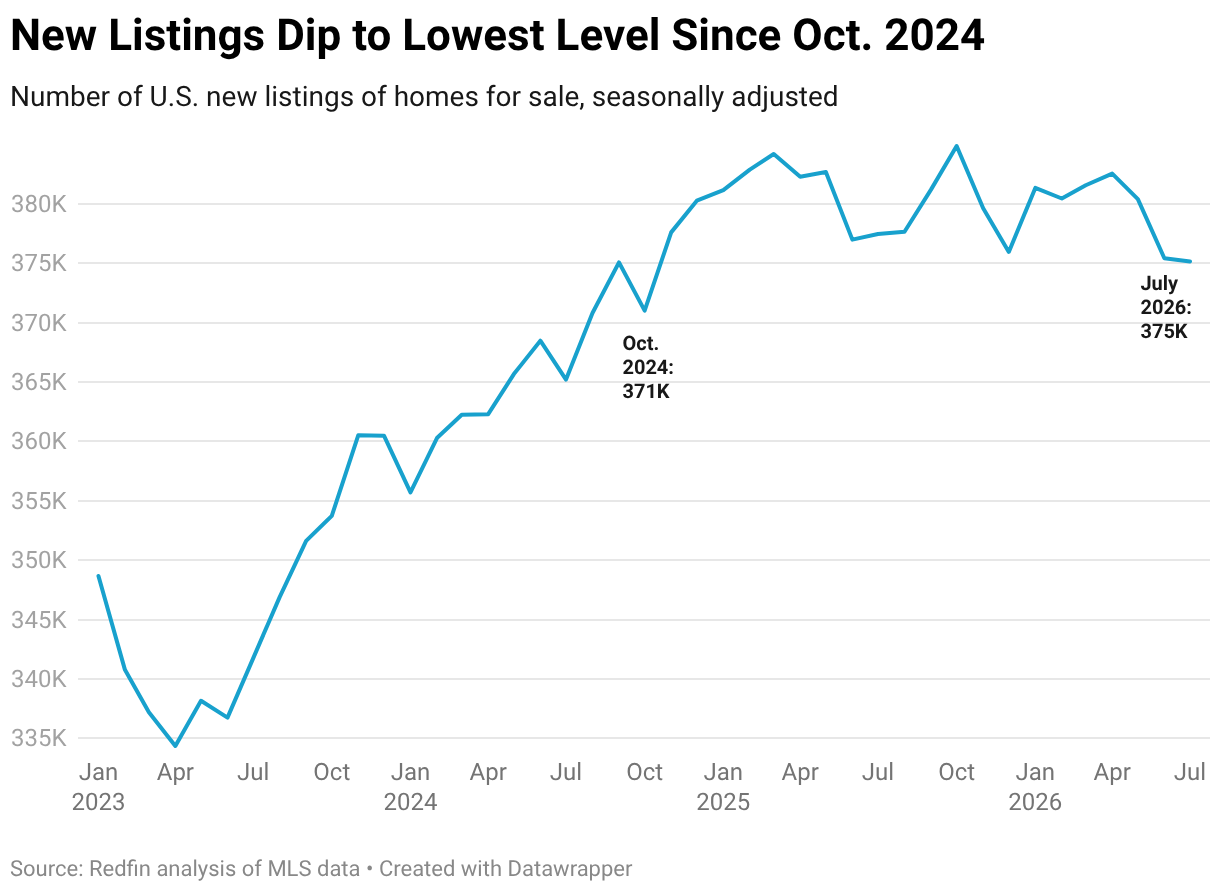
- There are plenty of homes to choose from. New listings fell slightly (-0.5%) from a week earlier, but they’re still up 1.5% year over year, and there are hundreds of thousands more home sellers than buyers in the market. More homes on the market equals less pressure on buyers to rush into a decision or pay more than they want “House hunters who can afford it should be taking advantage of today’s slow market. If and when mortgage rates trickle down below 6%, I’m willing to bet inventory will be depleted in no time–then it’s boom! Back to bidding wars,” says Meme Loggins, a Redfin Premier agent in Portland, OR.
- Home-sale prices are holding steady. The median home-sale price rose 2% year over year, similar to the increases we’ve seen over the last several months. That stability means prices aren’t soaring, and that sellers aren’t in immediate danger of home values dropping.
- Sellers are coming to terms with market realities. Elevated mortgage rates are making housing costs high and pricing some would-be buyers out of the market–and it appears sellers are adjusting their expectations accordingly. The typical home that sold spent 46 days on the market, unchanged from a year ago, and 29.5% of homes went off market within two weeks, essentially flat.
- Bidding wars are still on the table. A quarter of homes that sold (25.1%) fetched more than their asking price. That’s welcome news for sellers who price realistically from the start.
For Redfin economists’ takes on the housing market, please visit Redfin’s “From Our Economists” page.
Leading indicators
| Indicators of homebuying demand and activity | ||||
| Value (if applicable) | Recent change | Year-over-year change | Source | |
| Daily average 30-year fixed mortgage rate | 7.24% (Sept. 16) | Up from 6.97% one week earlier; near highest level since Jan. 2025 | Up from 6.25% | Mortgage News Daily |
| Weekly average 30-year fixed mortgage rate | 6.76% (week ending Sept. 10) | Up from 6.67% one month earlier | Up from 6.35% | Freddie Mac |
| Mortgage-purchase applications (seasonally adjusted) | Down 1% from a week earlier (as of week ending Sept. 11) | Down 19% | Mortgage Bankers Association | |
| Google searches of “homes for sale” | Down 12% from a month earlier (as of Sept. 12) | Down 15% | Google Trends | |
| Touring activity | Down 3% from the start of the year (as of Sept. 10) | At this time last year, it was up 26% from the start of 2025 | ShowingTime | |
Key housing-market data
| U.S. highlights: Four weeks ending Sept. 13, 2026
Redfin’s national metrics include data from 900+ U.S. metro areas and are based on homes listed and/or sold during the period. Weekly housing-market data goes back through 2021. Subject to revision. |
||||
| Four weeks ending Sept. 13, 2026 | Year-over-year change | Week-over-week change (where applicable) | Notes | |
| Median sale price | $397,633 | 2% | ||
| Median asking price (seasonally adjusted) | $395,841 | 0.1% | ||
| Median monthly mortgage payment (seasonally adjusted) | $2,633 at a 6.76% mortgage rate | 3.4% | ||
| Pending sales (seasonally adjusted) | 299,126 | -5.4% | -3.5% | Lowest level in nearly 3 years |
| New listings (seasonally adjusted) | 363,298 | 1.5% | -0.5% | |
| Active listings (seasonally adjusted) | 1,497,731 | 1.5% | -0.6% | |
| Months of supply | 4.1 | Up from 3.9 | 4 to 5 months of supply is considered balanced, with a lower number indicating seller’s market conditions | |
| Share of homes off market in two weeks | 29.5% | Down from 29.7% | ||
| Median days on market | 46 | Unchanged | ||
| Share of home listings with price drops | 20.8% | Up from 19.7% | ||
| Share of homes sold above list price | 25.1% | Up from 24.5% | ||
| Average sale-to-list price ratio | 98.6% | Up from 98.4% | ||
|
Metro-level highlights: Four weeks ending Sept. 13, 2026 Redfin’s metro-level rankings data includes the 50 most populous U.S. metros. Select metros may be excluded from time to time to ensure data accuracy. |
|||
|---|---|---|---|
|
Metros with biggest year-over-year increases |
Metros with biggest year-over-year decreases |
Notes | |
| Median sale price | San Francisco (10.2%)
Milwaukee (9.3%) Kansas City, MO (7.9%) Cleveland (7.6%) St. Louis (6.8%) |
San Jose, CA (-5%) Austin, TX (-4.6%) San Antonio (-4.3%) Seattle (-3.9%) Fort Worth, TX (-3.1%) |
|
| Pending sales | Fort Lauderdale, FL (6.6%)
Miami (4%) West Palm Beach, FL (3.8%) Milwaukee (3.8%) Cincinnati (2%) |
Seattle (-20.3%)
Denver (-15%) San Diego (-14.7%) Atlanta (-14.6%) Houston (-13.7%) |
|
| New listings | Nashville, TN (15.6%)
San Jose, CA (13.9%) Anaheim, CA (12.7%) Seattle (10.5%) Philadelphia (9.7%) |
Atlanta (-13.3%)
Dallas (-9.4%) San Francisco (-9.2%) Detroit (-7.2%) Fort Worth, TX (-6.3%) |
|
Refer to our metrics definition page for explanations of all the metrics used in this report.