- Summer 2025 was the only time in records dating back to 2013 that sellers outnumbered buyers by a larger percentage.
- This mismatch means it’s a buyer’s market, with many buyers successfully negotiating lower prices and or concessions from sellers.
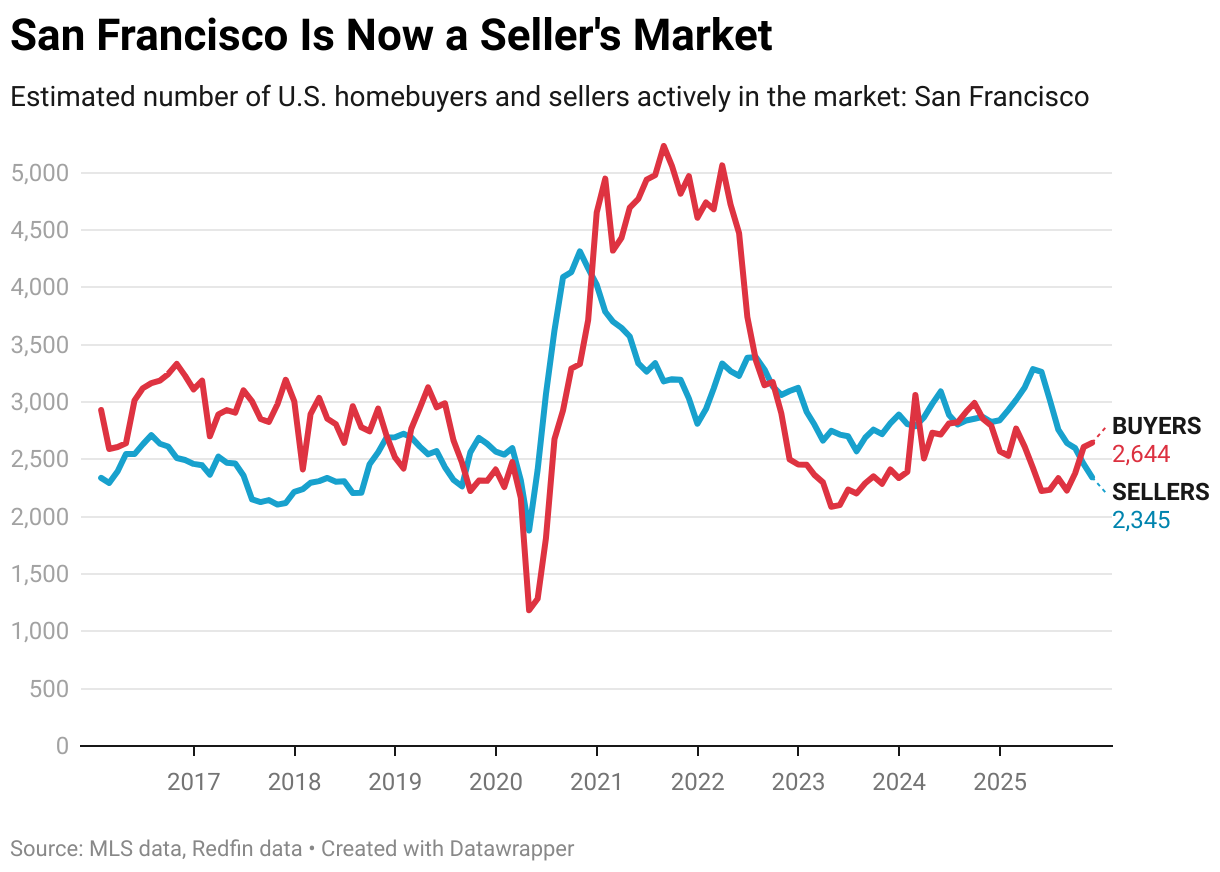
- Austin, TX is the strongest buyer’s market, while Nassau County, NY is the strongest seller’s market; San Francisco has pivoted from a buyer’s market to a seller’s market.
There were an estimated 37.2% more home sellers than buyers in the U.S. housing market in November (or 529,770 more, in numerical terms)—the largest gap in records dating back to 2013 aside from this summer. That’s up from 35.6% a month earlier and 17% a year earlier. The gap has been hovering above 35% since April.
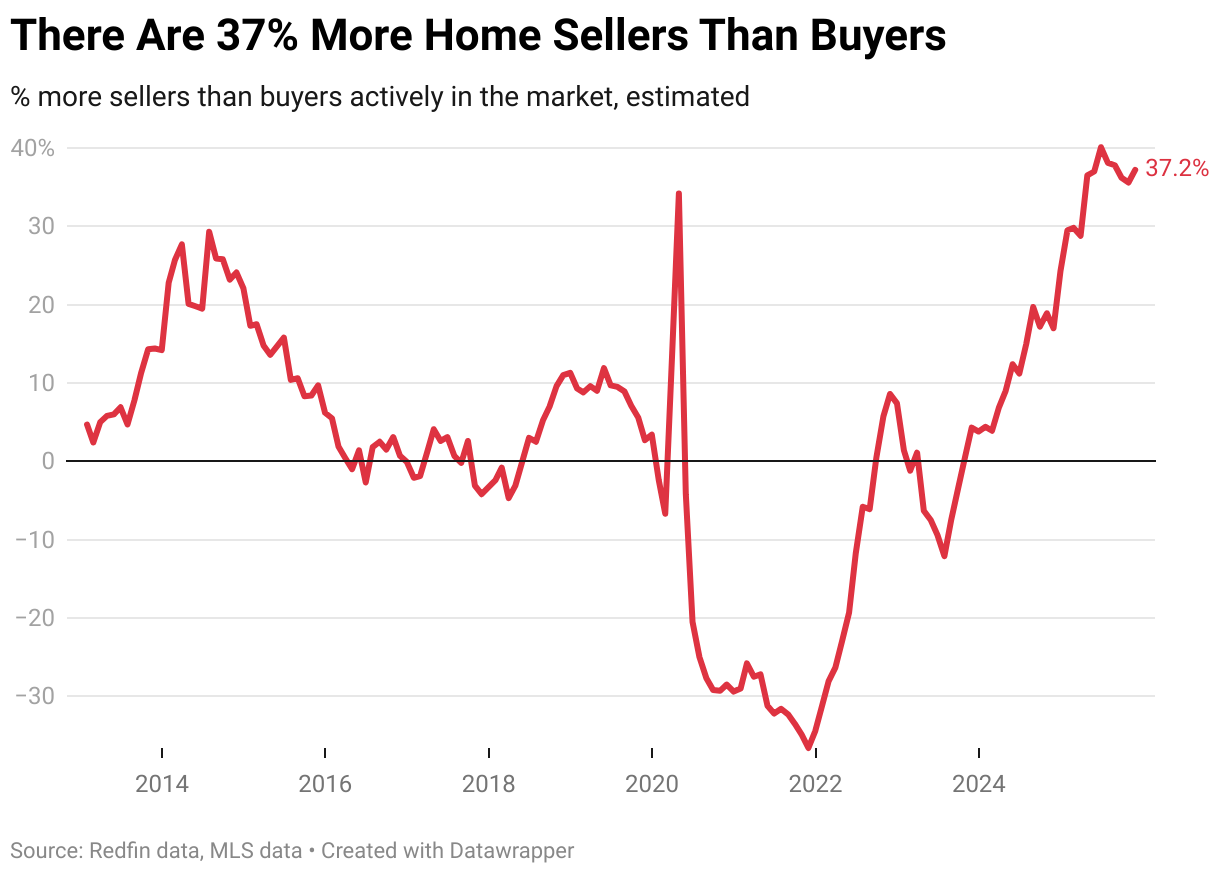
We define a market where there are over 10% more sellers than buyers as a buyer’s market and a market where there are over 10% fewer sellers than buyers as a seller’s market. A market where the gap is plus or minus 10% is considered a balanced market. By this definition, it has been a buyer’s market since May 2024.
When sellers outnumber buyers, buyers typically hold the negotiating power because they have a lot of options to choose from. That’s why a market with a lot more sellers than buyers is considered a buyer’s market. Of course, it’s only a buyer’s market for those who can afford to buy—many Americans have been priced out of the housing market as affordability has eroded.
“A modest improvement in housing affordability could bring some homebuyers off the sidelines in 2026, which could narrow the gap between homebuyers and sellers,” said Redfin Senior Economist Asad Khan. “But the housing market is likely to remain in buyer’s market territory for the foreseeable future, with sellers cutting prices or offering concessions to lure buyers.”
We estimated the number of buyers using proprietary Redfin data on the typical time from a buyer’s first tour to close of purchase, and MLS data on active listings and pending sales. The estimated number of sellers in the market is simply the number of active listings in the MLS. These estimates, along with median-sale price data in this report, are seasonally adjusted and subject to revision. See a more detailed methodology here and view an interactive dashboard here.
Number of Buyers Hits Second-Lowest Level on Record; Number of Sellers Posts Largest Decline in Two Years
The number of homebuyers in the U.S. housing market dropped 2.5% month over month in November to an estimated 1.43 million. That’s the biggest monthly decline since April 2025 and the lowest level on record aside from April 2020, when the coronavirus pandemic brought the housing market to a halt. The number of buyers fell 9.4% year over year.
Sellers have also been retreating, but not as quickly. The number of sellers in the market fell 1.4% month over month to an estimated 1.95 million—the largest decline since June 2023 and the lowest level since February. The number of sellers rose 6.2% year over year.
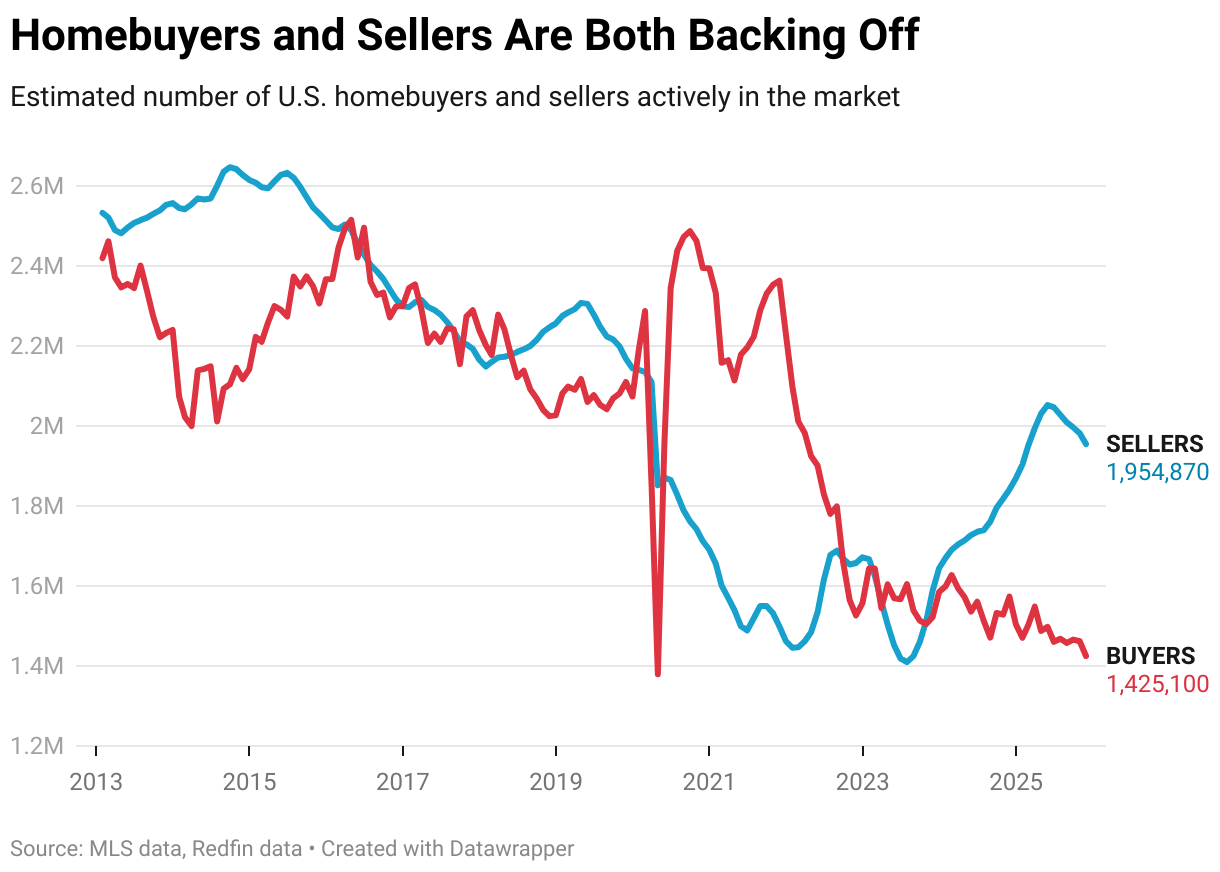
Buyers are backing off due to high housing costs and economic uncertainty. Sellers, many of whom are buyers themselves, are backing off in response to lackluster demand for their homes. Some sellers are delisting after watching their homes sit on the market for months with zero bites from buyers, while others are choosing not to list at all after seeing their neighbor’s house sell for under the asking price.
Austin, TX Is the Strongest Buyer’s Market; Nassau County, NY Is the Strongest Seller’s Market
In Austin, TX, there were an estimated 114% more sellers than buyers in November—the largest imbalance among the 50 most populous U.S. metropolitan areas. Next came San Antonio (106%), Nashville (104%), Fort Lauderdale, FL (102%) and West Palm Beach, FL (93.6%).
The Sun Belt skyrocketed in popularity during the pandemic, when scores of homebuyers moved in from more expensive parts of the country, driving up housing costs and pricing many locals out of the market. To meet surging demand, homebuilders ramped up activity, which is one reason there are now a lot more homes for sale than people who want to buy them.
Texas and Florida continue to build more homes than other states. Florida is also grappling with intensifying natural disasters, soaring insurance premiums and rising condo HOA fees, which has prompted some homeowners to leave.
Overall, 36 of the 50 most populous metros were buyer’s markets, seven were balanced markets and seven were seller’s markets. The buyer’s markets are concentrated in the Sun Belt and on the West Coast, while balanced markets and seller’s markets skew more toward the Midwest and East Coast.
Nassau County, NY was the strongest seller’s market in November, with an estimated 39.1% fewer sellers than buyers. The other six seller’s markets were Montgomery County, PA (-34.8%), Newark, NJ (-31.8%), New Brunswick, NJ (-30.5%), Milwaukee (-18%), San Francisco (-11.3%) and Cleveland (-10.5%).
New construction can have a significant influence on whether negotiating power lies with buyers or sellers because it impacts the balance of supply and demand. The Northeast and the Midwest issue the fewest building permits, while the South and the West issue the most.
Home prices rose an average of 4.8% year over year across the seven seller’s markets in November, compared with a 3.2% gain across balanced markets and a 1.1% increase across buyer’s markets—an indication that buyers in buyer’s markets have more leverage.
San Francisco Is Now a Seller’s Market
Last month, we reported that San Francisco had shifted from a buyer’s market to a balanced market. Now it has shifted from a balanced market to a seller’s market. There were 11.3% fewer sellers than buyers in San Francisco’s housing market in November, placing it in seller’s market territory. That compares with 5.7% fewer in October.
Redfin reported in October that the Bay Area housing market was heating up, with homebuyer demand rising amid a boom in the AI industry and a return to the office.
Metro-Level Summary: 50 Most Populous Metros (November 2025)
| U..S. metro area | Balance of power | Percent by which sellers outnumber buyers | Buyers | Sellers |
|---|---|---|---|---|
| Anaheim, CA | Buyer's Market | 18.9% | 5,957 | 7,083 |
| Atlanta, GA | Buyer's Market | 69.6% | 22,014 | 37,342 |
| Austin, TX | Buyer's Market | 114.3% | 8,104 | 17,364 |
| Baltimore, MD | Balanced Market | 0.1% | 10,425 | 10,435 |
| Boston, MA | Balanced Market | -7.3% | 11,814 | 10,951 |
| Charlotte, NC | Buyer's Market | 78.1% | 9,264 | 16,496 |
| Chicago, IL | Balanced Market | -2.3% | 26,271 | 25,665 |
| Cincinnati, OH | Buyer's Market | 35.2% | 6,204 | 8,388 |
| Cleveland, OH | Seller's Market | -10.5% | 7,781 | 6,962 |
| Columbus, OH | Buyer's Market | 36.9% | 6,496 | 8,892 |
| Dallas, TX | Buyer's Market | 84.4% | 16,867 | 31,107 |
| Denver, CO | Buyer's Market | 46.7% | 10,568 | 15,502 |
| Detroit, MI | Buyer's Market | 46.8% | 5,032 | 7,387 |
| Fort Lauderdale, FL | Buyer's Market | 102.5% | 9,718 | 19,676 |
| Fort Worth, TX | Buyer's Market | 67.4% | 7,735 | 12,944 |
| Houston, TX | Buyer's Market | 83.9% | 23,834 | 43,825 |
| Indianapolis, IN | Buyer's Market | 24.3% | 7,603 | 9,452 |
| Jacksonville, FL | Buyer's Market | 76.9% | 7,320 | 12,952 |
| Kansas City, MO | Buyer's Market | 32.5% | 6,891 | 9,128 |
| Las Vegas, NV | Buyer's Market | 86.5% | 7,385 | 13,769 |
| Los Angeles, CA | Buyer's Market | 43.1% | 15,077 | 21,579 |
| Miami, FL | Buyer's Market | 70.5% | 12,038 | 20,526 |
| Milwaukee, WI | Seller's Market | -18.0% | 5,813 | 4,767 |
| Minneapolis, MN | Balanced Market | -2.5% | 13,785 | 13,439 |
| Montgomery County, PA | Seller's Market | -34.8% | 7,937 | 5,174 |
| Nashville, TN | Buyer's Market | 103.7% | 7,584 | 15,451 |
| Nassau County, NY | Seller's Market | -39.1% | 12,253 | 7,457 |
| New Brunswick, NJ | Seller's Market | -30.5% | 12,874 | 8,948 |
| New York, NY | Balanced Market | -1.1% | 29,403 | 29,090 |
| Newark, NJ | Seller's Market | -31.8% | 8,750 | 5,965 |
| Oakland, CA | Buyer's Market | 19.7% | 4,879 | 5,840 |
| Orlando, FL | Buyer's Market | 58.7% | 11,456 | 18,178 |
| Philadelphia, PA | Buyer's Market | 18.4% | 6,988 | 8,275 |
| Phoenix, AZ | Buyer's Market | 61.1% | 19,157 | 30,860 |
| Pittsburgh, PA | Buyer's Market | 43.8% | 6,544 | 9,411 |
| Portland, OR | Buyer's Market | 49.2% | 7,296 | 10,888 |
| Providence, RI | Balanced Market | -1.8% | 4,412 | 4,332 |
| Riverside, CA | Buyer's Market | 56.0% | 11,975 | 18,680 |
| Sacramento, CA | Buyer's Market | 23.0% | 5,895 | 7,251 |
| San Antonio, TX | Buyer's Market | 105.8% | 8,867 | 18,252 |
| San Diego, CA | Buyer's Market | 23.3% | 6,286 | 7,749 |
| San Francisco, CA | Seller's Market | -11.3% | 2,644 | 2,345 |
| San Jose, CA | Balanced Market | -1.4% | 2,573 | 2,536 |
| Seattle, WA | Buyer's Market | 23.1% | 7,642 | 9,406 |
| St. Louis, MO | Buyer's Market | 11.5% | 8,827 | 9,842 |
| Tampa, FL | Buyer's Market | 85.6% | 13,191 | 24,479 |
| Virginia Beach, VA | Buyer's Market | 12.9% | 7,138 | 8,056 |
| Warren, MI | Buyer's Market | 15.0% | 7,681 | 8,834 |
| Washington, DC | Buyer's Market | 18.2% | 15,088 | 17,840 |
| West Palm Beach, FL | Buyer's Market | 93.6% | 8,650 | 16,748 |