- There are just 3 seller’s markets among the 50 most populous U.S. metros, and they’re all in the Northeast: Nassau County, NY, Newark, NJ and Montgomery County, PA.
- Nationwide, house hunters had more negotiating power in October than at any point since at least 2013, with 71% more home sellers than buyers.
- The number of buyers in the market fell to a new record low, while the number of sellers rose to its highest level since March 2020.
- 41 of the 50 most populous U.S. metro areas are buyer’s markets, led by Miami, Nashville and Las Vegas.
Just three of the 50 most populous U.S. metro areas were seller’s markets in October. That’s tied for the fewest in records dating back to 2016, matching April 2020, when the pandemic froze the housing market.
Nassau County, NY was the number-one seller’s market, with 24.7% fewer sellers than buyers. The other seller’s markets were Newark, NJ (-14.3%) and Montgomery County, PA (-12.1%).
All three seller’s markets became less strong seller’s markets in October. In Nassau County, there were 28.3% fewer sellers than buyers in September, a bigger gap than October’s 24.7%. Newark’s gap shrunk from 17.6% to 14.3%, and Montgomery County’s shrunk from 20.1% to 12.1%. Milwaukee, which was a seller’s market in September, is now balanced, meaning it doesn’t favor sellers or buyers.
The seller’s markets are places where limited homebuilding has kept housing supply tight. In the greater New York City area, combine that with strong demand for homes near a major job center, and buyers are competing for homes. Home-sale prices rose an average of 3.3% year over year across the three seller’s markets in October. That’s compared with a 0.3% uptick across all of the buyer’s markets, a sign that in seller’s markets, competition among buyers is pushing up home prices.
“Buyers looking in these pockets of the Northeast should be prepared for a very different experience than buyers elsewhere in the country,” said Redfin Senior Economist Asad Khan. “They may have less room to negotiate, especially on desirable, move-in-ready homes, and could face multiple-offer situations. If you’re shopping in one of these markets, it’s especially important to know your budget, be ready to act when the right home comes along and avoid getting swept up in a bidding war.”
Home Sellers Outnumber Buyers Nationwide By Widest Margin Since Post-Recession Financial Crisis For 6th Straight Month
Seller’s markets are the exception to a national picture that heavily favors buyers.
Nationwide, homebuyers have more negotiating power than at any point in Redfin’s records. There were an estimated 70.5% more home sellers than buyers in the U.S. housing market in October, the biggest gap in records dating back to 2013.
That marks the sixth record-breaking month in a row, and the margin is up from 65.6% in September. The Sun Belt is driving the extreme buyer’s market nationwide, led by huge seller surpluses in Miami, Nashville, TN and Las Vegas.
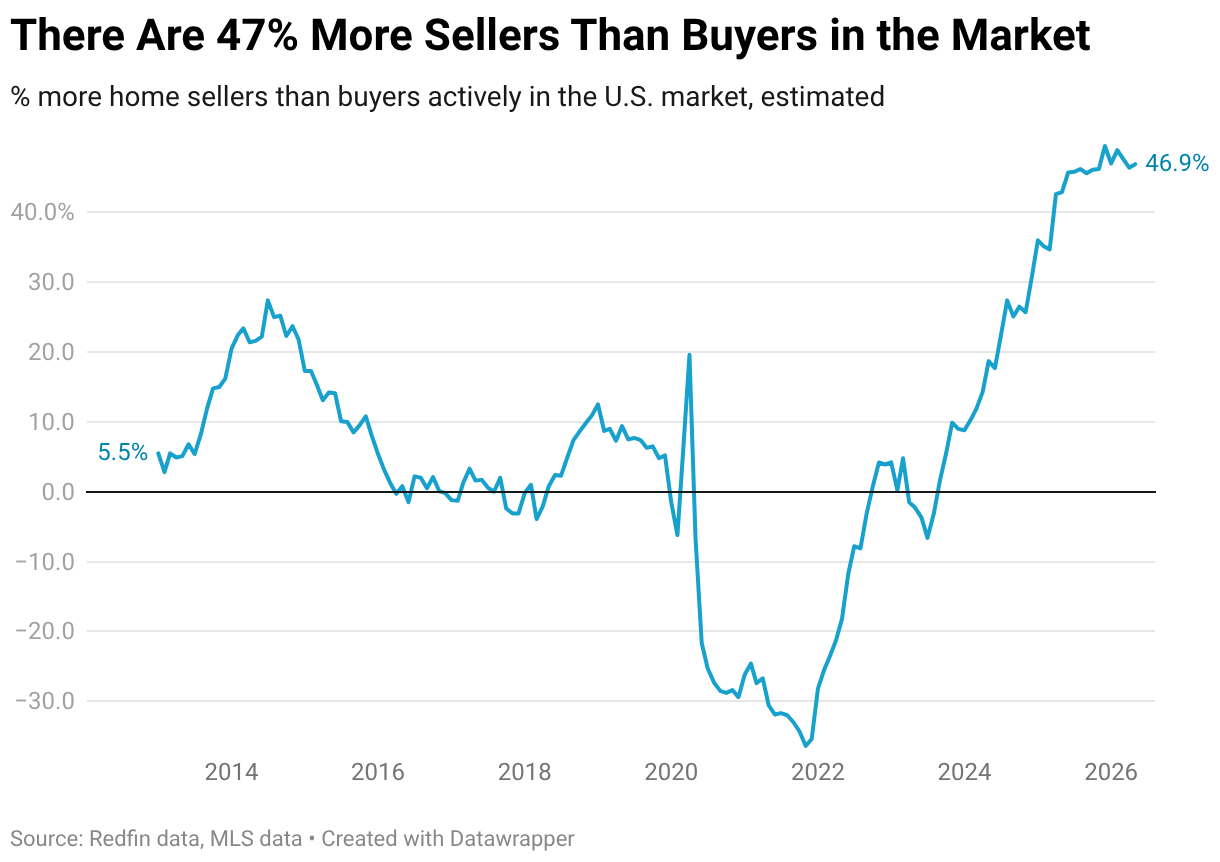
When sellers outnumber buyers, buyers typically have more negotiating power because they have options. That’s why a market with a lot more sellers than buyers is considered a buyer’s market. We define a market where there are over 10% more sellers than buyers as a buyer’s market and a market where there are over 10% fewer sellers than buyers as a seller’s market. A market where the gap is plus or minus 10% is considered a balanced market.
We estimated the number of buyers using proprietary Redfin data on the typical time from a buyer’s first tour to close of purchase, and MLS data on active listings and pending sales. The estimated number of sellers in the market is simply the number of active listings in the MLS. These estimates are seasonally adjusted and subject to revision. See a more detailed methodology here and view an interactive dashboard here.
It’s only a buyer’s market for people who can afford to buy. High housing costs and economic jitters have pushed many would-be homebuyers to back off in recent years, creating the imbalance between buyers and sellers we see today.
“A buyer-friendly market can help make homeownership a little more attainable, even if it doesn’t solve the affordability challenges that have kept many people on the sidelines,” Khan said. “Sellers are increasingly competing for buyers’ attention, which can translate into price reductions, concessions and other savings. First-time buyers don’t have equity from a previous home to put toward a purchase, which makes saving for a down payment a big hurdle–but they also don’t have to sell a home before they can buy or give up a low mortgage rate. With a historic buyer’s market and home prices that are finally ticking down after three years of increases, first-time buyers who have been waiting–and can afford today’s costs–may have an opportunity to make a move.”
Homebuyer Count Drops to New Record Low, Widening the Buyer-Seller Gap
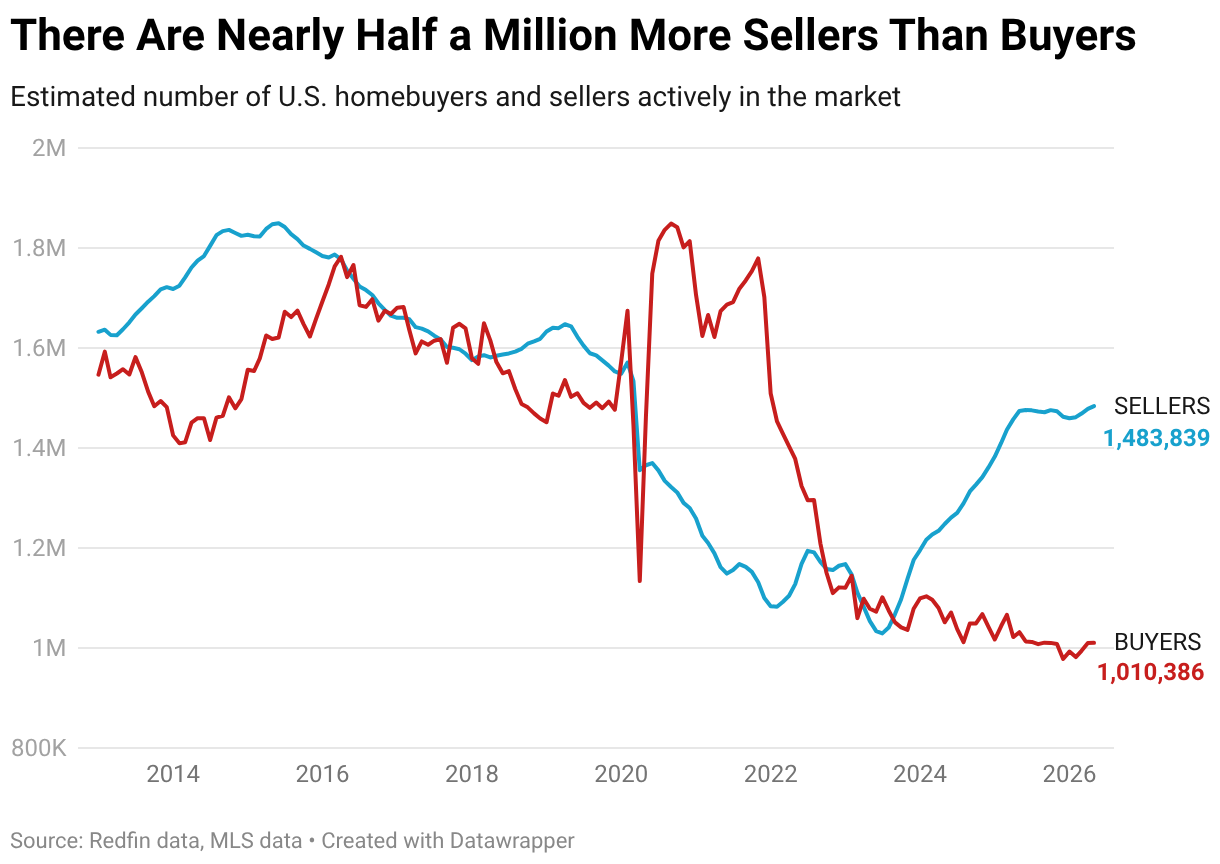
The gap between buyers and sellers widened in October because would-be buyers retreated, while sellers continued listing their homes, albeit at a sluggish pace.
There were an estimated 895,752 homebuyers in the market nationwide in October, the lowest level in records dating back to 2013. That’s down 2% from a month earlier, the sixth straight monthly decline. Mortgage rates averaged 7.33% in October, up from 6.86% in September, which priced out more would-be buyers.
On the flip side, there were an estimated 1,526,984 home sellers in the market, the most since March 2020. That’s up 0.9% month over month.
The number of homes on the market is piling up because many homes are lingering on the market for months without going under contract. Each month, more new listings are adding to the big pool of supply.
Some homeowners keep listing their houses despite falling demand because many have given up on waiting for lower rates. They may want to sell now because they’re worried prices could decline, and some need to move for a new job, a growing family, or another life change. But many homeowners who don’t need to move have substantial equity and little pressure to sell, so they may hold off on listing.
Buyers Have More Negotiating Power in Miami Than Anywhere Else in the Country
Over 80% of U.S. metro areas, 41 of the 50 Redfin analyzed, are buyer’s markets. That matches September’s record.
For the third month in a row, Miami and Nashville have the biggest surpluses of sellers over buyers. Miami had 195.8% more sellers than buyers in October, and Nashville had 159.5% more. Las Vegas (149.9%) was third on the list. In the top 13 buyer’s markets, there were more than twice as many sellers as buyers in October. Nearly all are in the Sun Belt; four are in Texas and four are in Florida.
The Sun Belt, particularly Texas and Florida, is home to some of the nation’s biggest buyer’s markets, partly because of robust homebuilding. Builders are continuing to add new homes even as demand cools, swelling inventory and giving buyers more options and negotiating power.
Demand has cooled largely because rising mortgage rates and stubbornly high home prices are pricing buyers out. In Florida, rising HOA and homeowners insurance costs are exacerbating the affordability squeeze.
Six metros were “balanced” in October, neither buyer’s nor seller’s markets: Chicago (8.1% more sellers than buyers), Boston (7.5%), Providence, RI (7.5%), New Brunswick, NJ (5.6%), Milwaukee (0.6% fewer sellers than buyers) and San Francisco (6.9% fewer).
In Nearly All the Buyer’s Markets, Buyers Got Even More Power
The surplus of home sellers over buyers grew month over month in 34 of the 41 buyer’s markets in October.
The surplus increased most in Miami, which also has the biggest surplus of sellers over buyers; there were 195.8% more sellers than buyers in October, up from 160.5% the month before. The next-biggest monthly increases were in Las Vegas, where there were 149.9% more sellers than buyers, up from 122.8%, and Nashville (159.5%, up from 134.3%).
House hunters lost negotiating power in seven buyer’s markets. The surplus of sellers over buyers fell from September to October in Fort Worth, TX (91.6%, down from 100%), St. Louis (23.1%, down from 27.1%), Austin (124.8%, down from 128.2%), Dallas (118.6%, down from 120.5%), Jacksonville, FL, Pittsburgh and Los Angeles. All of them remain buyer’s markets.
Metro-Level Summary: 50 Most Populous U.S. Metro Areas
| U.S. metro area | Balance of power | Percent by which sellers outnumber buyers | Buyers | Sellers |
| Anaheim, CA | Buyer’s Market | 36.8% | 5,556 | 7,599 |
| Atlanta, GA | Buyer’s Market | 121.0% | 18,257 | 40,350 |
| Austin, TX | Buyer’s Market | 124.8% | 7,938 | 17,846 |
| Baltimore, MD | Buyer’s Market | 24.4% | 9,192 | 11,431 |
| Boston, MA | Balanced Market | 7.5% | 12,250 | 13,167 |
| Charlotte, NC | Buyer’s Market | 99.3% | 8,890 | 17,720 |
| Chicago, IL | Balanced Market | 8.1% | 23,914 | 25,840 |
| Cincinnati, OH | Buyer’s Market | 54.3% | 5,838 | 9,006 |
| Cleveland, OH | Buyer’s Market | 30.9% | 6,130 | 8,026 |
| Columbus, OH | Buyer’s Market | 57.1% | 5,950 | 9,347 |
| Dallas, TX | Buyer’s Market | 118.6% | 14,125 | 30,871 |
| Denver, CO | Buyer’s Market | 82.5% | 8,994 | 16,419 |
| Detroit, MI | Buyer’s Market | 44.5% | 5,020 | 7,252 |
| Fort Lauderdale, FL | Buyer’s Market | 124.4% | 7,917 | 17,768 |
| Fort Worth, TX | Buyer’s Market | 91.6% | 6,562 | 12,575 |
| Houston, TX | Buyer’s Market | 144.7% | 19,442 | 47,576 |
| Indianapolis, IN | Buyer’s Market | 46.5% | 7,095 | 10,396 |
| Jacksonville, FL | Buyer’s Market | 78.8% | 6,793 | 12,147 |
| Kansas City, MO | Buyer’s Market | 30.8% | 6,886 | 9,009 |
| Las Vegas, NV | Buyer’s Market | 149.9% | 5,718 | 14,292 |
| Los Angeles, CA | Buyer’s Market | 72.0% | 13,318 | 22,901 |
| Miami, FL | Buyer’s Market | 195.8% | 6,439 | 19,051 |
| Milwaukee, WI | Balanced Market | -0.6% | 5,417 | 5,386 |
| Minneapolis, MN | Buyer’s Market | 33.0% | 11,244 | 14,959 |
| Montgomery County, PA | Seller’s Market | -12.1% | 6,724 | 5,908 |
| Nashville, TN | Buyer’s Market | 159.5% | 6,471 | 16,791 |
| Nassau County, NY | Seller’s Market | -24.7% | 10,921 | 8,226 |
| New Brunswick, NJ | Balanced Market | 5.6% | 9,556 | 10,090 |
| New York, NY | Buyer’s Market | 17.7% | 25,536 | 30,060 |
| Newark, NJ | Seller’s Market | -14.3% | 7,866 | 6,742 |
| Oakland, CA | Buyer’s Market | 42.3% | 3,967 | 5,644 |
| Orlando, FL | Buyer’s Market | 130.9% | 8,683 | 20,050 |
| Philadelphia, PA | Buyer’s Market | 63.9% | 5,684 | 9,317 |
| Phoenix, AZ | Buyer’s Market | 117.4% | 14,726 | 32,020 |
| Pittsburgh, PA | Buyer’s Market | 62.0% | 6,258 | 10,139 |
| Portland, OR | Buyer’s Market | 74.5% | 6,362 | 11,104 |
| Providence, RI | Balanced Market | 7.5% | 4,633 | 4,982 |
| Riverside, CA | Buyer’s Market | 100.6% | 9,493 | 19,045 |
| Sacramento, CA | Buyer’s Market | 50.7% | 5,068 | 7,639 |
| San Antonio, TX | Buyer’s Market | 131.7% | 8,120 | 18,814 |
| San Diego, CA | Buyer’s Market | 40.9% | 5,606 | 7,900 |
| San Francisco, CA | Balanced Market | -6.9% | 2,623 | 2,443 |
| San Jose, CA | Buyer’s Market | 29.3% | 2,638 | 3,410 |
| Seattle, WA | Buyer’s Market | 96.7% | 6,032 | 11,865 |
| St. Louis, MO | Buyer’s Market | 23.1% | 9,083 | 11,182 |
| Tampa, FL | Buyer’s Market | 111.1% | 12,796 | 27,014 |
| Virginia Beach, VA | Buyer’s Market | 39.0% | 6,012 | 8,359 |
| Warren, MI | Buyer’s Market | 49.5% | 6,777 | 10,130 |
| Washington, DC | Buyer’s Market | 48.5% | 13,612 | 20,211 |
| West Palm Beach, FL | Buyer’s Market | 70.6% | 8,760 | 14,946 |