U.S. home prices increased 0.27% month over month in July on a seasonally adjusted basis. That growth rate is essentially flat from 0.28% in June.
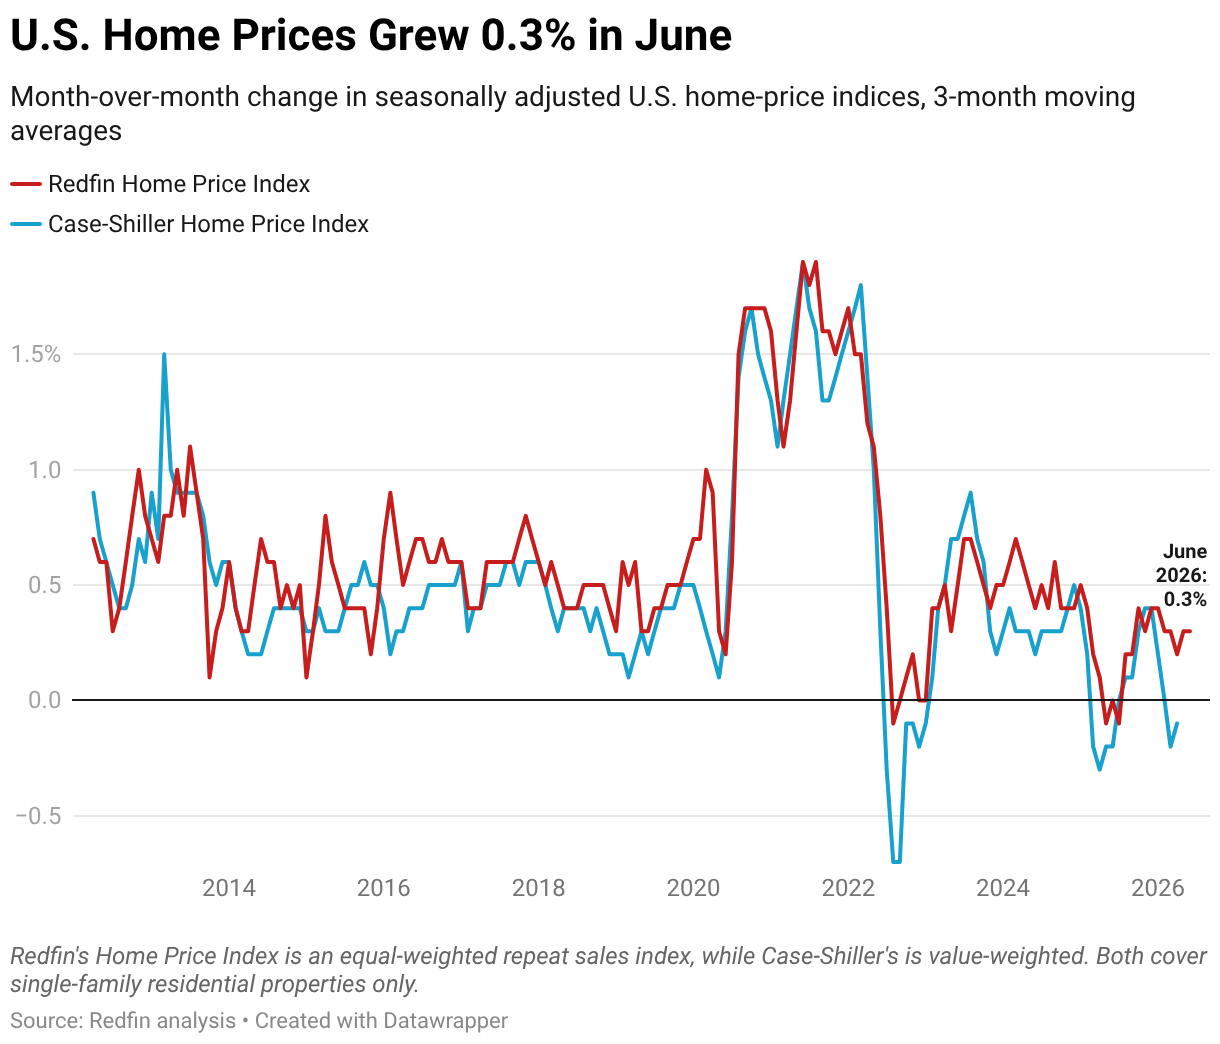
Prices rose 3.4% from a year earlier, the fastest annual growth in a year.
This is according to the Redfin Home Price Index (RHPI), which uses the repeat-sales pricing method to calculate seasonally adjusted changes in single-family home prices. The RHPI measures how sale prices of homes have changed since their previous sale—similar to the S&P Cotality Case-Shiller Home Price Indices—but is reported about a month earlier. July data covers the three months ending July 31, 2026. Read the full RHPI methodology here.
Flat home-price growth is a reflection of housing market dynamics. Buyers are still contending with high housing costs–including mortgage rates that have sat in the mid-to-high 6% range all summer–which is keeping a lid on demand. At the same time, there are hundreds of thousands more sellers than buyers in the market, which caps price growth.
Still, the slowdown is very modest: Home prices are still rising, and they’re rising at only a marginally slower pace than they were late in the spring. The strong luxury market is one reason why price growth remains fairly strong despite tepid demand. Luxury home prices are rising faster than non-luxury prices; wealthy homebuyers are having an outsized impact on home-price growth, especially in affluent markets like the Bay Area and South Florida. San Francisco and Oakland, CA lead the nation in price growth, and West Palm Beach, FL comes in fourth.
“Despite the sluggishness of the overall housing market, home-price growth is proving to be surprisingly resilient,” said Chen Zhao, Redfin’s head of economics research. “That’s partly because today’s market is split in two: Many everyday buyers are constrained by affordability challenges, while wealthy buyers have the means to keep competing for desirable homes. That upper-end strength is helping prop up prices even as the broader market cools, giving buyers some bargaining power.”
Home Prices Are Rising in Most Major Metros, Led by San Francisco
Home prices rose in 29 major U.S. metros month over month on a seasonally adjusted basis in July. Redfin analyzed the 50 most populous U.S. metro areas, and included the 49 with sufficient data.
The biggest uptick was in San Francisco, where home prices rose 1.5% month over month. It’s followed by neighboring Oakland, where prices increased 1.3%. Next come Pittsburgh (1%), New York (1%) West Palm Beach (0.9%) and Cincinnati (0.9%).
Prices are surging in the Bay Area largely because the AI boom has led to strong homebuying demand. In West Palm Beach, affluent buyers are driving the market, with luxury homes selling for ultra-high prices.
Prices declined in 20 of the metros in this analysis, with the biggest drop in Montgomery County, PA (-1.1% month over month). It’s followed by Fort Worth, TX (-0.8%), Austin, TX (-0.6%), Miami (-0.6%) and Virginia Beach, VA (-0.6%).
On a year-over-year basis, prices also rose most in San Francisco in July, which notched a 13.3% annual increase. It’s followed by Chicago (9.5%), Nassau County, NY (9.4%), Milwaukee (9%) and West Palm Beach (8.9%).
The biggest year-over-year declines were in Texas. San Antonio (-2.1%) is first, followed by Fort Worth (-1.3%), Dallas (-1%), Austin (-1%) and Phoenix (-0.9%). Prices are falling in those places because in each of them, there are roughly twice as many sellers as buyers. That leads sellers to price lower to attract house hunters and, in some cases, buyers are able to negotiate prices down.
| Metro-Level Summary: Redfin Home Price Index, July 2026 | ||
| U.S. metro area | Month-over-month change,
seasonally adjusted |
Year-over-year change |
| Anaheim, CA | 0.8% | 5.3% |
| Atlanta, GA | 0.2% | 1.1% |
| Austin, TX | -0.6% | -1.0% |
| Baltimore, MD | 0.4% | 4.2% |
| Boston, MA | 0.4% | 2.8% |
| Charlotte, NC | 0.3% | 3.6% |
| Chicago, IL | -0.3% | 9.5% |
| Cincinnati, OH | 0.9% | 6.4% |
| Cleveland, OH | -0.2% | 8.7% |
| Columbus, OH | -0.1% | 5.4% |
| Dallas, TX | 0.0% | -1.0% |
| Denver, CO | -0.4% | 0.3% |
| Detroit, MI | 0.7% | 7.4% |
| Fort Worth, TX | -0.8% | -1.3% |
| Houston, TX | -0.2% | -0.8% |
| Indianapolis, IN | 0.6% | 0.6% |
| Jacksonville, FL | 0.5% | -0.4% |
| Kansas City, MO | 0.5% | 4.5% |
| Las Vegas, NV | 0.0% | 0.8% |
| Los Angeles, CA | 0.7% | 4.2% |
| Miami, FL | -0.6% | 6.9% |
| Milwaukee, WI | -0.1% | 9.0% |
| Minneapolis, MN | 0.4% | 3.8% |
| Montgomery County, PA | -1.1% | 6.4% |
| Nashville, TN | 0.0% | 3.0% |
| Nassau County, NY | -0.2% | 9.4% |
| New Brunswick, NJ | 0.7% | 5.8% |
| New York, NY | 1.0% | 6.6% |
| Newark, NJ | -0.4% | 7.6% |
| Oakland, CA | 1.3% | 2.5% |
| Orlando, FL | 0.3% | 0.2% |
| Philadelphia, PA | 0.2% | 6.5% |
| Phoenix, AZ | 0.1% | -0.9% |
| Pittsburgh, PA | 1.0% | 4.7% |
| Portland, OR | -0.2% | 1.6% |
| Providence, RI | -0.1% | 5.2% |
| Riverside, CA | 0.2% | 1.3% |
| Sacramento, CA | -0.5% | 0.3% |
| San Antonio, TX | 0.1% | -2.1% |
| San Diego, CA | -0.2% | 2.3% |
| San Francisco, CA | 1.5% | 13.3% |
| San Jose, CA | -0.1% | 2.1% |
| Seattle, WA | 0.1% | 0.6% |
| St. Louis, MO | 0.2% | 3.6% |
| Tampa, FL | 0.2% | 3.7% |
| Virginia Beach, VA | -0.6% | 5.0% |
| Warren, MI | 0.4% | 4.2% |
| Washington, DC | 0.5% | 5.0% |
| West Palm Beach, FL | 0.9% | 8.9% |