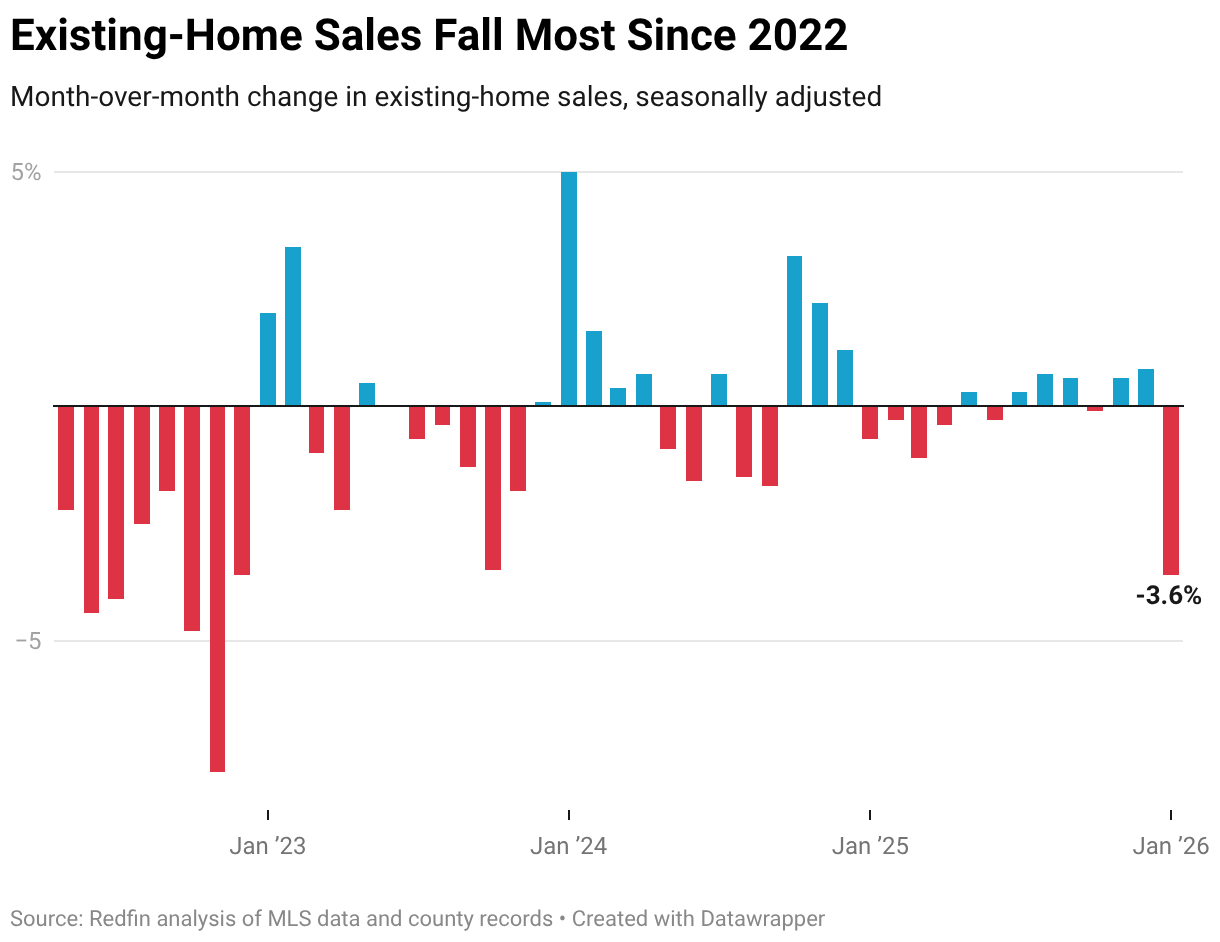
- Pending home sales fell to the lowest level since 2023 and existing-home sales dropped the most since 2022 as elevated housing costs curbed homebuyer demand.
- Sellers also retreated, but still far outnumbered buyers, meaning the buyers who were in the market could negotiate on price.
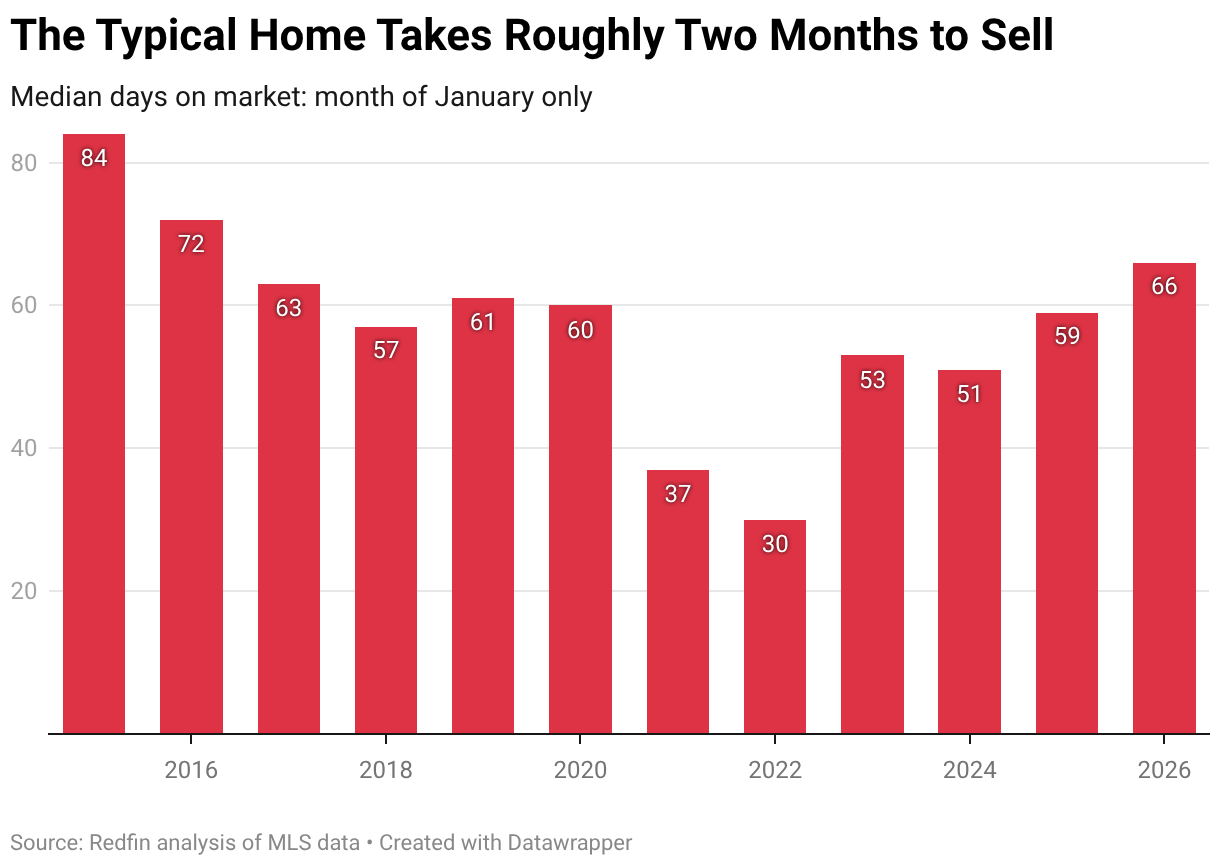
- The typical home that went under contract did so in 66 days—the slowest January pace in a decade.
The median U.S. home sale price rose 1.1% year over year in January to $422,921 as the strongest buyer’s market in recent history kept a lid on price growth.
Year-over-year price growth has hovered below 2% for the past 10 months—a far cry from the double-digit gains of the pandemic homebuying frenzy.
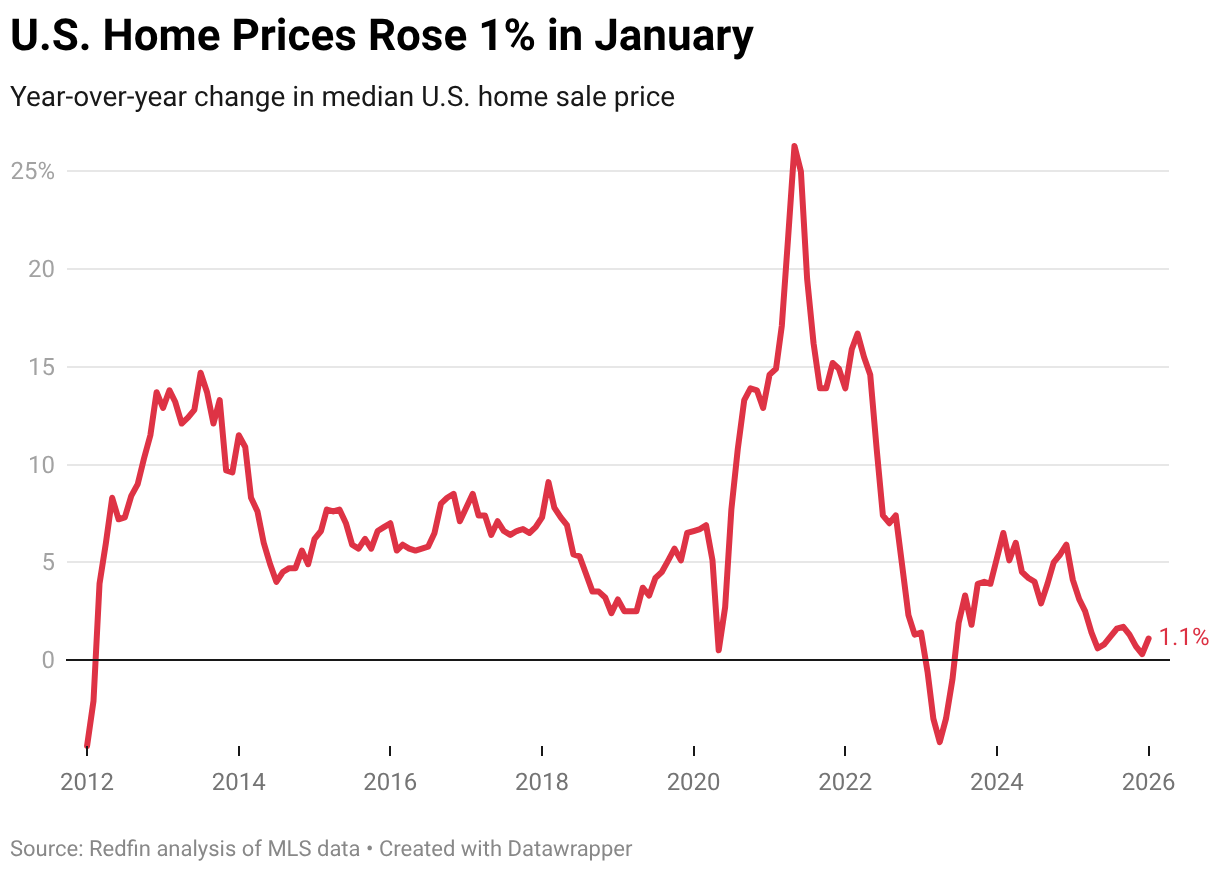
“Home prices grew so fast for so long that a lot of buyers got shut out of the market, which is now causing price growth to cool,” said Redfin Senior Economist Asad Khan. “With far more homes for sale than people who want to buy them, the buyers who are in the market have the power to negotiate on price, which is keeping price growth in check.”
When sellers outnumber buyers, buyers typically hold the negotiating power because they have a lot of options to choose from. That’s why a market with a lot more sellers than buyers is considered a buyer’s market. Of course, it’s only a buyer’s market for those who can afford to buy.
The typical home that sold in January went for 2.1% less than its final list price—the biggest January discount since 2023. And just 20.8% of homes sold for more than their final list price—the lowest January share since 2020.
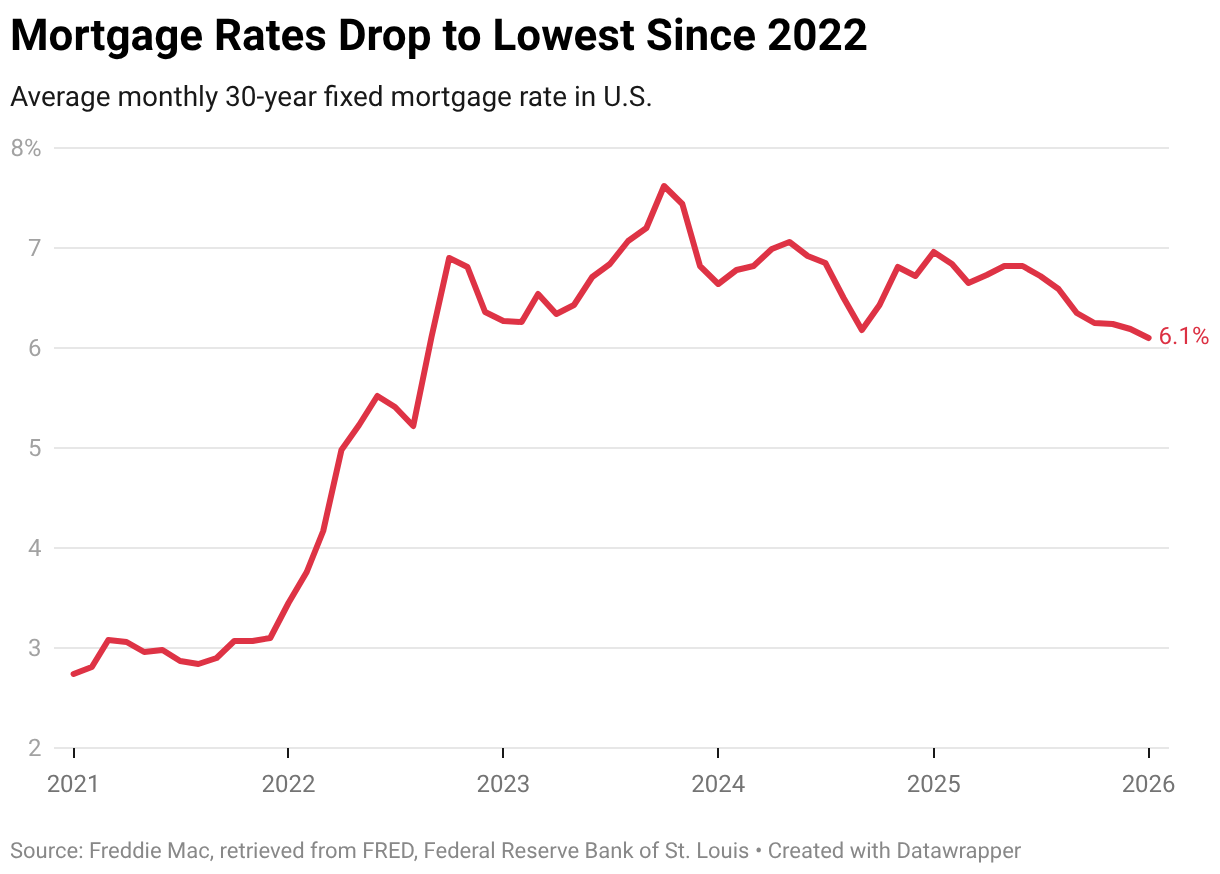
Redfin economists predicted in December that housing affordability will improve in 2026 as income growth outpaces home-price growth. Wages climbed 3.7% year over year in January—more than triple the gain in prices. A drop in mortgage rates has also boosted purchasing power. The average 30-year fixed mortgage rate fell to 6.1% in January—the lowest level since 2022.
Home Sales Sink as Many Buyers Remain Priced Out of the Market
While home-price growth has slowed and mortgage rates have dipped, housing affordability hasn’t improved enough to bring a critical mass of homebuyers off the sidelines. The median home sale price was at the highest January level on record last month, and mortgage rates were still more than double the record low hit during the pandemic. Redfin agents say many house hunters are waiting for rates to fall further before jumping in.
Pending home sales fell 0.9% month over month in January to the lowest seasonally adjusted level since November 2023. Existing-home sales declined 3.6% month over month—the largest drop since November 2022—to a seasonally adjusted annual rate of 4.2 million. Overall home sales fell 2.3% month over month—the biggest seasonally adjusted decline since December 2022.
Affordability challenges, along with economic uncertainty, have made homebuyers skittish. Winter storms also swept much of the U.S. in January, which may have dampened sales. Some buyers got cold feet at the eleventh hour; nearly 40,000 home purchases were canceled in January, equal to 13.7% of homes that went under contract that month. That’s the highest January share in records dating back to 2017.
Sellers Have Retreated in Response to Sluggish Homebuyer Demand
Active listings of homes for sale fell 1.3% month over month—the largest decline since June 2023—to the lowest seasonally adjusted level in nearly a year.
New listings did tick up, rising 1.4% month over month on a seasonally adjusted basis, but fell from a year earlier.
In general, home sellers have been retreating because buyers have been retreating. Many prospective sellers are also in the market for their next home and may opt not to sell because buying that next home is too expensive.
Homes Are Selling at the Slowest Pace in a Decade
While home sellers have been backing off, they still far outnumber buyers, which means homes are taking a long time to sell.
The typical home that went under contract in January spent 66 days on the market. That’s the slowest January pace in a decade and is up from 59 days a year earlier.
January 2026 Housing Market Highlights: United States
| January 2026 | Month-over-month change | Year-over-year change | |
|---|---|---|---|
| Median sale price | $422,921 | -1.1% | 1.1% |
| Existing-home sales, seasonally adjusted annual rate | 4,165,366 | -3.6% | -2.7% |
| Pending home sales, seasonally adjusted | 464,140 | -0.9% | -3.6% |
| Homes sold, seasonally adjusted | 419,492 | -2.3% | -4.2% |
| New listings, seasonally adjusted | 534,176 | 1.4% | -6.1% |
| Total homes for sale, seasonally adjusted (active listings) | 1,961,858 | -1.3% | 1.9% |
| Months of supply | 4.3 | 1.4 | 0.3 |
| Median days on market | 66 | 6 | 7 |
| Share of homes that sold above final list price | 20.8% | -1.6 ppts | -1.7 ppts |
|
Average sale-to-final-list-price ratio |
97.9% | -0.2 ppts | -0.3 ppts |
|
Pending sales that fell out of contract, as % of overall pending sales |
13.7% | -1.9 ppts |
0.6 ppts |
| Monthly average 30-year fixed mortgage rate | 6.10% | -0.09 ppts |
-0.86 ppts |
January 2026 Metro-Level Highlights
The figures below are based on a list of the 50 most populous U.S. metropolitan areas. Some metros may be removed from time to time to ensure data accuracy. Refer to our metrics definition page for explanations of metrics used in this report. Metro-level data are not seasonally adjusted. All changes below represent year-over-year changes.
- Prices: Median sale prices rose most from a year earlier in Milwaukee (10.8%), Philadelphia (10%) and Cleveland (8.4%). They fell most in San Jose, CA (-5.6%), Portland, OR (-3.6%) and Fort Lauderdale, FL (-2.7%).
- Pending home sales: Pending sales rose most in West Palm Beach, FL (8.2%), Columbus, OH (4.9%) and Jacksonville, FL (4.6%). They fell most in San Francisco (-21.5%), Oakland, CA (-21.3%) and San Jose (-19.2%).
- Closed home sales: Home sales rose in just five metros, with the largest increases in Virginia Beach, VA (10.4%), Kansas City, MO (2.3%) and Pittsburgh (1.6%). They fell most in San Jose (-17%), Minneapolis (-16.4%) and Chicago (-15.4%).
- New listings: New listings rose most in Kansas City, MO (13.7%), San Jose (12.4%) and St. Louis (9.9%). They fell most in Jacksonville (-17.3%), Fort Lauderdale (-15.7%) and Dallas (-14.2%).
- Active listings: Active listings rose most in Detroit (16.6%), Baltimore (15.5%) and Washington, D.C. (11.4%). They fell most in San Francisco (-18.3%), Jacksonville (-12.5%) and West Palm Beach (-8.3%).
- Days on market: In San Antonio, the typical home that went under contract did so in 105 days, which was 21 days longer than a year earlier—the biggest increase among the metros analyzed. Next came Houston (+19 days) and Las Vegas (+18 days). Three metros saw a decrease in days on market: San Francisco (-13), Fort Worth, TX (-1) and Minneapolis (-1).
- Sold above list price: In Newark, NJ, 52.9% of homes sold above their final list price, the highest share among the metros analyzed. Next came San Jose (47.7%) and Nassau County, NY (46.4%). The lowest shares were in West Palm Beach (5.6%), Fort Lauderdale (6.2%) and Miami (7.7%).
January 2026 Full Metro-Level Data
| U.S. metro area | Median sale price | Median sale price, Y/Y change | Pending sales, Y/Y change | Homes sold, Y/Y change | New listings, Y/Y change | Active listings, Y/Y change | Median days on market | Median days on market, Y/Y change |
|---|---|---|---|---|---|---|---|---|
| Anaheim, CA | $1,190,000 | -0.6% | -0.1% | -2.5% | -3.0% | -1.9% | 61 | 6 |
| Atlanta, GA | $375,650 | -1.1% | -1.6% | -9.5% | 1.7% | 7.5% | 78 | 8 |
| Austin, TX | $409,434 | -1.1% | 1.2% | -11.5% | -8.3% | 3.7% | 108 | 12 |
| Baltimore, MD | $375,000 | 4.2% | 2.3% | -11.0% | 2.8% | 15.5% | 54 | 12 |
| Boston, MA | $734,000 | 2.1% | -11.2% | -7.7% | -12.3% | 4.7% | 36 | 4 |
| Charlotte, NC | $400,000 | 1.3% | N/A | -9.7% | 0.0% | 9.5% | 84 | 10 |
| Chicago, IL | $348,000 | 3.9% | -4.4% | -15.4% | -2.3% | -5.7% | 70 | 0 |
| Cincinnati, OH | $289,900 | 5.0% | -3.5% | -10.9% | 3.1% | 5.6% | 59 | 4 |
| Cleveland, OH | $222,250 | 8.4% | -8.2% | -15.1% | -6.4% | 1.2% | 45 | 4 |
| Columbus, OH | $340,000 | 6.3% | 4.9% | -4.0% | -5.1% | 4.0% | 69 | 5 |
| Dallas, TX | $392,183 | -2.1% | -10.7% | -9.8% | -14.2% | -0.9% | 85 | 11 |
| Denver, CO | $565,000 | -1.7% | -4.5% | -14.9% | -0.5% | 4.1% | 69 | 11 |
| Detroit, MI | $180,000 | 4.1% | -1.8% | -14.9% | 0.8% | 16.6% | 47 | 10 |
| Fort Lauderdale, FL | $447,500 | -2.7% | 0.1% | -2.4% | -15.7% | -6.7% | 106 | 14 |
| Fort Worth, TX | $349,999 | 0.0% | -6.8% | -5.4% | -11.2% | -3.8% | 71 | -1 |
| Houston, TX | $325,000 | 0.0% | -11.5% | -7.1% | -4.2% | 4.7% | 79 | 19 |
| Indianapolis, IN | $300,000 | 2.0% | -4.3% | -6.3% | -7.3% | 7.6% | 53 | 12 |
| Jacksonville, FL | $353,750 | -0.5% | 4.6% | -7.2% | -17.3% | -12.5% | 90 | 6 |
| Kansas City, MO | $330,000 | 4.8% | N/A | 2.3% | 13.7% | 1.4% | 48 | 3 |
| Las Vegas, NV | $435,000 | -1.1% | -6.7% | -8.4% | -10.1% | 8.6% | 78 | 18 |
| Los Angeles, CA | $880,000 | -0.6% | -4.1% | -4.7% | -8.3% | -0.9% | 69 | 9 |
| Miami, FL | $560,000 | 0.9% | -1.8% | -2.9% | -13.0% | -3.3% | 99 | 9 |
| Milwaukee, WI | $332,250 | 10.8% | -6.5% | -12.0% | -5.5% | 0.4% | 62 | 5 |
| Minneapolis, MN | $375,000 | 0.0% | -17.9% | -16.4% | -11.6% | -2.3% | 53 | -1 |
| Montgomery County, PA | $488,500 | 4.1% | -8.4% | -12.6% | -7.6% | 2.8% | 47 | 10 |
| Nashville, TN | $455,000 | -1.1% | -4.3% | -7.0% | -13.3% | 9.4% | 91 | 13 |
| Nassau County, NY | $745,000 | 5.7% | -11.6% | -8.2% | -12.9% | -6.0% | 39 | 6 |
| New Brunswick, NJ | $549,500 | -0.1% | -11.3% | -11.7% | -8.8% | 0.4% | 51 | 3 |
| New York, NY | $777,750 | 0.4% | -18.2% | -12.3% | -9.6% | -1.4% | 65 | 8 |
| Newark, NJ | $595,000 | 3.5% | -14.7% | -7.3% | -3.3% | 8.0% | 49 | 13 |
| Oakland, CA | $835,000 | 1.8% | -21.3% | -4.8% | -12.6% | -6.5% | 47 | 8 |
| Orlando, FL | $400,000 | 0.0% | -7.3% | -6.5% | -13.1% | -5.6% | 70 | 6 |
| Philadelphia, PA | $287,000 | 10.0% | -8.4% | -11.0% | -5.8% | 0.6% | 61 | 8 |
| Phoenix, AZ | $459,000 | -1.9% | 1.4% | 1.4% | -1.7% | 3.3% | 76 | 8 |
| Pittsburgh, PA | $229,000 | 1.8% | -12.1% | 1.6% | -2.4% | 0.9% | 77 | 3 |
| Portland, OR | $525,000 | -3.6% | -1.9% | -11.9% | -7.4% | 0.9% | 65 | 8 |
| Providence, RI | $514,500 | 7.2% | -14.1% | -8.9% | -8.5% | 2.6% | 38 | 3 |
| Riverside, CA | $575,000 | -2.5% | -0.5% | -3.1% | -9.8% | -5.3% | 70 | 9 |
| Sacramento, CA | $565,000 | -0.2% | -2.9% | -5.3% | -9.5% | 2.4% | 56 | 12 |
| San Antonio, TX | $292,000 | -1.0% | -10.5% | -15.3% | -4.2% | 0.7% | 105 | 21 |
| San Diego, CA | $899,750 | 0.8% | -3.1% | -8.5% | -11.6% | -2.5% | 46 | 4 |
| San Francisco, CA | $1,387,500 | 0.1% | -21.5% | -11.6% | -7.7% | -18.3% | 38 | -13 |
| San Jose, CA | $1,400,000 | -5.6% | -19.2% | -17.0% | 12.4% | -4.0% | 33 | 5 |
| Seattle, WA | $758,000 | -2.2% | -13.3% | -13.0% | -2.6% | 10.5% | 56 | 17 |
| St. Louis, MO | $255,500 | -0.6% | N/A | -3.1% | 9.9% | 10.0% | 43 | 6 |
| Tampa, FL | $372,000 | 3.1% | -9.6% | -13.6% | -12.9% | -4.2% | 64 | 10 |
| Virginia Beach, VA | $353,000 | 2.3% | 1.6% | 10.4% | -3.4% | 0.7% | 48 | 6 |
| Warren, MI | $305,500 | 6.3% | -15.3% | -12.5% | -11.2% | 4.3% | 45 | 9 |
| Washington, DC | $545,000 | 3.8% | 0.6% | -12.7% | -3.7% | 11.4% | 66 | 15 |
| West Palm Beach, FL | $530,000 | 1.0% | 8.2% | 0.6% | -6.5% | -8.3% | 96 | 8 |