- Homebuying affordability is improving nationwide after nearly five years during which it generally worsened. That’s because mortgage rates are lower and home-price growth is muted.
- Affordability is improving in 37 of the 50 most populous U.S. metro areas.
- It’s improving fastest in Dallas, where the income needed to buy a home has dropped 7.4% year over year. Next come Sacramento and Jacksonville, both places where the income required declined by roughly 6%.
- In just 12 metros, the typical household earns enough money to afford the median-priced home, led by Pittsburgh, St. Louis and Cleveland.
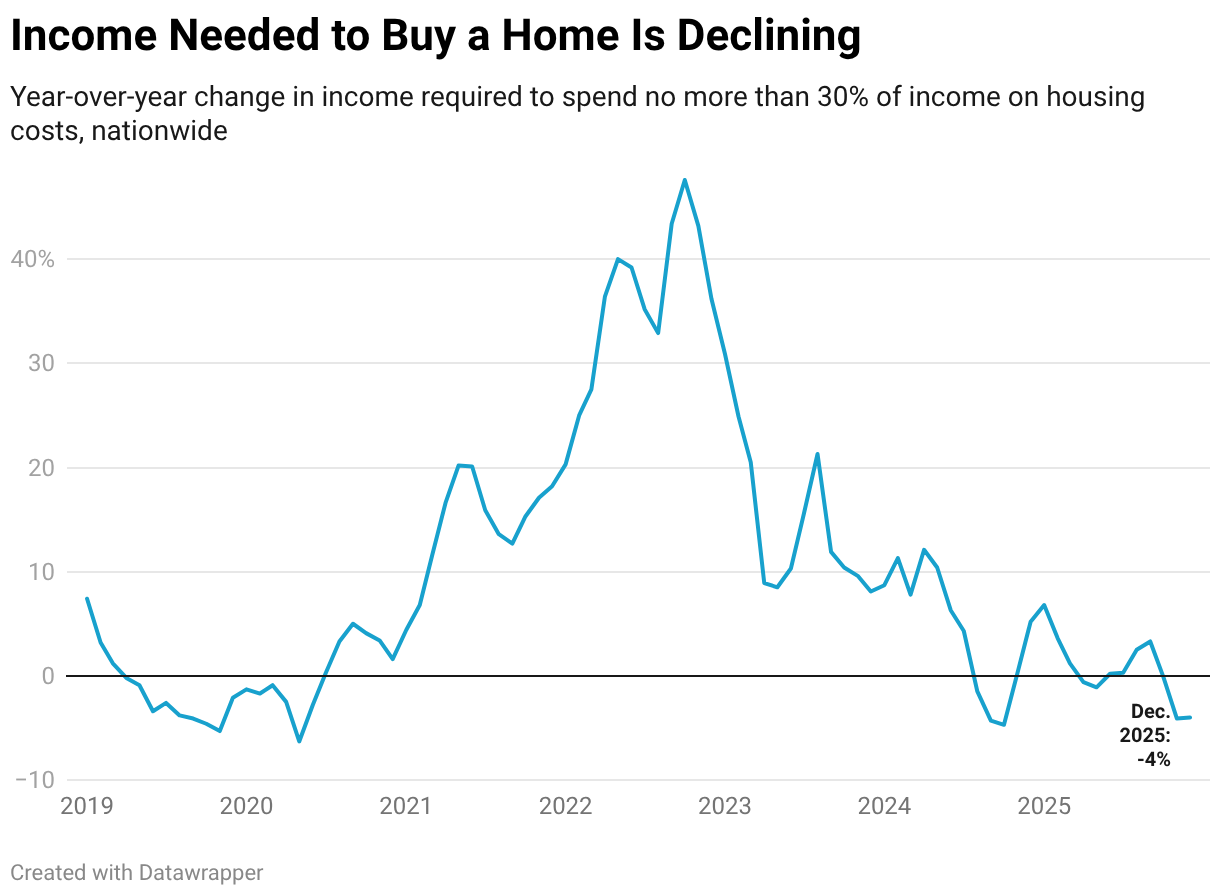
Americans need to earn $111,252 per year to afford the typical U.S. home for sale, down 4% from $115,870 a year ago.
The income needed to buy a home has been declining since November, providing some much-needed relief for U.S. homebuyers. Before that, the income needed to afford a home had been rising on a year-over-year basis nearly every month for five years straight, since the pandemic homebuying boom drove up home-sale prices. The income needed to buy a home peaked at over $122,000 this past June.

We consider a home affordable if a buyer taking out a mortgage spends no more than 30% of their income on their monthly housing payment. This is based on a Redfin analysis of median home sale prices, along with prevailing mortgage rates and property-tax payments. This report focuses on December 2025—the most recent period for which data is available—and comparable periods in past years.
Zooming in on local regions, homebuying affordability is improving in 37 of the 50 most populous U.S. metro areas. Affordability has improved most in Dallas, Sacramento, CA and Jacksonville, FL.
Homebuying affordability is improving nationwide because monthly housing costs are lower than they were a year ago. The median home-sale price is $426,747, just slightly higher than last year, but average mortgage rates are sitting around 6.1%, down from nearly 7% last year. That makes the median monthly mortgage payment around $2,675, down from roughly $2,800 a year ago.
That has pushed the annual income required to buy a home down.
Homebuyers are getting better deals than they have in the last several years. A recent Redfin analysis found that buyers are scoring the biggest discounts in 13 years, and another Redfin report shows that there are hundreds of thousands more buyers than sellers in the market, upping buyers’ negotiating power and pushing sale prices down.
“The housing affordability crisis is showing signs of easing as costs come down slightly but meaningfully, opening the door for more Americans to make the jump to homeownership,” said Chen Zhao, Redfin’s head of economics research. “While housing remains historically expensive, the trajectory is finally starting to reverse, with the door to buying a home opening a bit wider rather than closing tighter. But while affordability is improving, Americans are contending with other obstacles on the road to buying a home, like nerves about layoffs and economic uncertainty.”
The typical American household earns an estimated $86,185, roughly $25,000 less than the income needed to afford the median-priced home. So while monthly housing costs have come down enough for some higher earners to buy a home, lower earners are still priced out by a wide margin. But the trajectory is moving in the right direction: The median household income rose by about 4% from 2024 to 2025.
Redfin economists expect affordability to continue gradually improving throughout the year as wages continue rising while housing costs stay mostly stagnant.
Affordability Improves in Most Major Metros, Led By Dallas and Sacramento
In Dallas, homebuyers need to earn $112,175 to afford the median-priced home, down 7.4% year over year–the biggest decline among the 50 metros in this analysis. The next-biggest declines are in Sacramento, CA (-6.8% to $148,102) and Jacksonville, FL (-5.9% to $97,898). San Jose, CA and Austin, TX round out the top five.
Affordability is improving most in these places because home prices have declined most. Zooming in on monthly payments, the typical monthly housing payment in Dallas is $3,191 per month, downabout $300 from $3,426 per month a year ago. In Sacramento, the typical monthly housing payment is $3,752, down from $4,090, and in Jacksonville, it’s $2,161, down from $2,337.
All in all, homebuying affordability has improved in 37 of the 50 most populous metros.
On the flip side, homebuyers need to earn more than last year in some places where sale prices have increased. The biggest increase is in Detroit, where buyers must earn $74,912 to afford the typical home, up 3.6% year over year. It’s followed closely by Chicago ($105,440, up 3.5%) and St. Louis ($73,984, up 3%). Buffalo, NY and Cincinnati round out the top five.
The Typical Household Can Afford a Home in These 12 Metros
In the U.S. overall, the typical household doesn’t earn enough money to comfortably afford a home. But homes are affordable to the typical household in 12 of the 50 most populous metro areas, all places where the typical home costs less than the national median.
In Pittsburgh, homebuyers need to earn $66,168 per year to afford the median-priced home, and the typical local household earns $82,188. That makes Pittsburgh the metro where buyers have the most room in their budgets for monthly mortgage payments. Next comes St. Louis, where people need $73,984 to buy a home and the typical household earns $87,471. Cleveland rounds out the top three: Buyers need to earn $66,725, compared to a median income of $76,912.
Here are the other metros where households typically earn enough to comfortably afford the median mortgage payment: Oklahoma City, Louisville, KY, Detroit, Indianapolis, Cincinnati, Birmingham, AL, Minneapolis, Baltimore and Kansas City, MO.
In Coastal California, Typical Households Earn Half What’s Needed to Afford a Home
San Jose homebuyers must earn $374,241 annually to afford the median-priced home, the highest income of the metros in this analysis. Next come three other coastal California metros: San Francisco ($291,256), Los Angeles ($248,307) and San Diego ($231,151). New York ($196,544) rounds out the top five.
Those are also the places where the gap between what households actually earn and what they should earn to buy a home is biggest. The typical household in each of those metros earns roughly half the income needed to afford a home.
| Metro-Level Summary: Homebuying Affordability and Year-Over-Year Change
December 2025 50 most populous U.S. CSBAs (core-based statistical area) |
|||
| U.S. metro area | Median home-sale price | Income required to afford a home | Income required to afford a home, YoY |
| Atlanta, GA | $385,000 | $102,054 | -4.8% |
| Austin, TX | $432,000 | $129,868 | -5.7% |
| Baltimore, MD | $397,000 | $106,047 | -1.0% |
| Birmingham, AL | $292,400 | $73,030 | -3.4% |
| Boston, MA | $707,113 | $190,354 | -2.7% |
| Buffalo, NY | $270,000 | $79,919 | 2.7% |
| Charlotte, NC | $411,000 | $104,642 | -0.4% |
| Chicago, IL | $348,732 | $105,440 | 3.5% |
| Cincinnati, OH | $302,010 | $81,487 | 1.7% |
| Cleveland, OH | $230,000 | $66,725 | -1.8% |
| Columbus, OH | $340,000 | $92,935 | -1.5% |
| Dallas, TX | $377,379 | $112,175 | -7.4% |
| Denver, CO | $570,000 | $145,010 | -5.0% |
| Detroit, MI | $271,412 | $74,912 | 3.6% |
| Hartford, CT | $375,000 | $109,337 | 1.1% |
| Houston, TX | $335,000 | $100,005 | -2.2% |
| Indianapolis, IN | $310,000 | $82,052 | -2.1% |
| Jacksonville, FL | $370,000 | $97,898 | -5.9% |
| Kansas City, MO | $337,487 | $90,370 | -1.1% |
| Las Vegas, NV | $445,000 | $111,088 | -2.9% |
| Los Angeles, CA | $970,307 | $248,307 | -4.4% |
| Louisville, KY | $275,950 | $72,089 | 0.9% |
| Memphis, TN | $289,000 | $73,401 | 1.1% |
| Miami, FL | $502,398 | $133,999 | -4.2% |
| Milwaukee, WI | $330,500 | $91,724 | 0.3% |
| Minneapolis, MN | $383,000 | $103,665 | -1.8% |
| Nashville, TN | $463,250 | $115,215 | -3.8% |
| New Orleans, LA | $290,000 | $74,566 | -2.1% |
| New York, NY | $699,496 | $196,544 | 0.4% |
| Oklahoma City, OK | $265,000 | $69,078 | -1.5% |
| Orlando, FL | $400,000 | $105,887 | -4.3% |
| Philadelphia, PA | $385,274 | $107,012 | 1.2% |
| Phoenix, AZ | $469,000 | $115,987 | -3.7% |
| Pittsburgh, PA | $240,000 | $66,168 | 0.8% |
| Portland, OR | $545,000 | $144,235 | -2.9% |
| Providence, RI | $500,000 | $134,379 | 0.1% |
| Raleigh, NC | $429,840 | $112,043 | -4.8% |
| Richmond, VA | $395,000 | $101,427 | -5.3% |
| Riverside, CA | $585,000 | $152,255 | -3.9% |
| Sacramento, CA | $565,000 | $148,102 | -6.8% |
| Salt Lake City, UT | $544,900 | $137,568 | -0.9% |
| San Antonio, TX | $310,000 | $91,124 | -4.5% |
| San Diego, CA | $900,000 | $231,151 | -2.0% |
| San Francisco, CA | $1,115,640 | $291,256 | -0.5% |
| San Jose, CA | $1,457,500 | $374,241 | -5.9% |
| Seattle, WA | $731,810 | $192,503 | -4.2% |
| St. Louis, MO | $275,000 | $73,984 | 3.0% |
| Tampa, FL | $385,000 | $102,032 | -2.2% |
| United States | $426,747 | $111,252 | -4.0% |
| Virginia Beach, VA | $365,000 | $95,773 | -1.4% |
| Washington, DC | $577,138 | $153,209 | -0.3% |