- Home sales and new listings were little changed from a month and a year earlier in October, and prices have also shown signs of flattening. Housing-market activity is plateauing as Americans grapple with high costs and economic uncertainty.
- Still, buyers have the upper hand; the typical home that sold went for 1.5% less than its final list price—the biggest October discount since 2019. Buyers are able to negotiate because they are outnumbered by sellers.
- While sales and listings are plateauing on average, that isn’t the case everywhere; in San Francisco, for example, demand is jumping and supply is shrinking.
The rollercoaster ride that the U.S. housing market has been on for the past five years appears to be leveling out.
Numerous housing metrics were flat in October—a notable shift from the ups and downs of recent years.
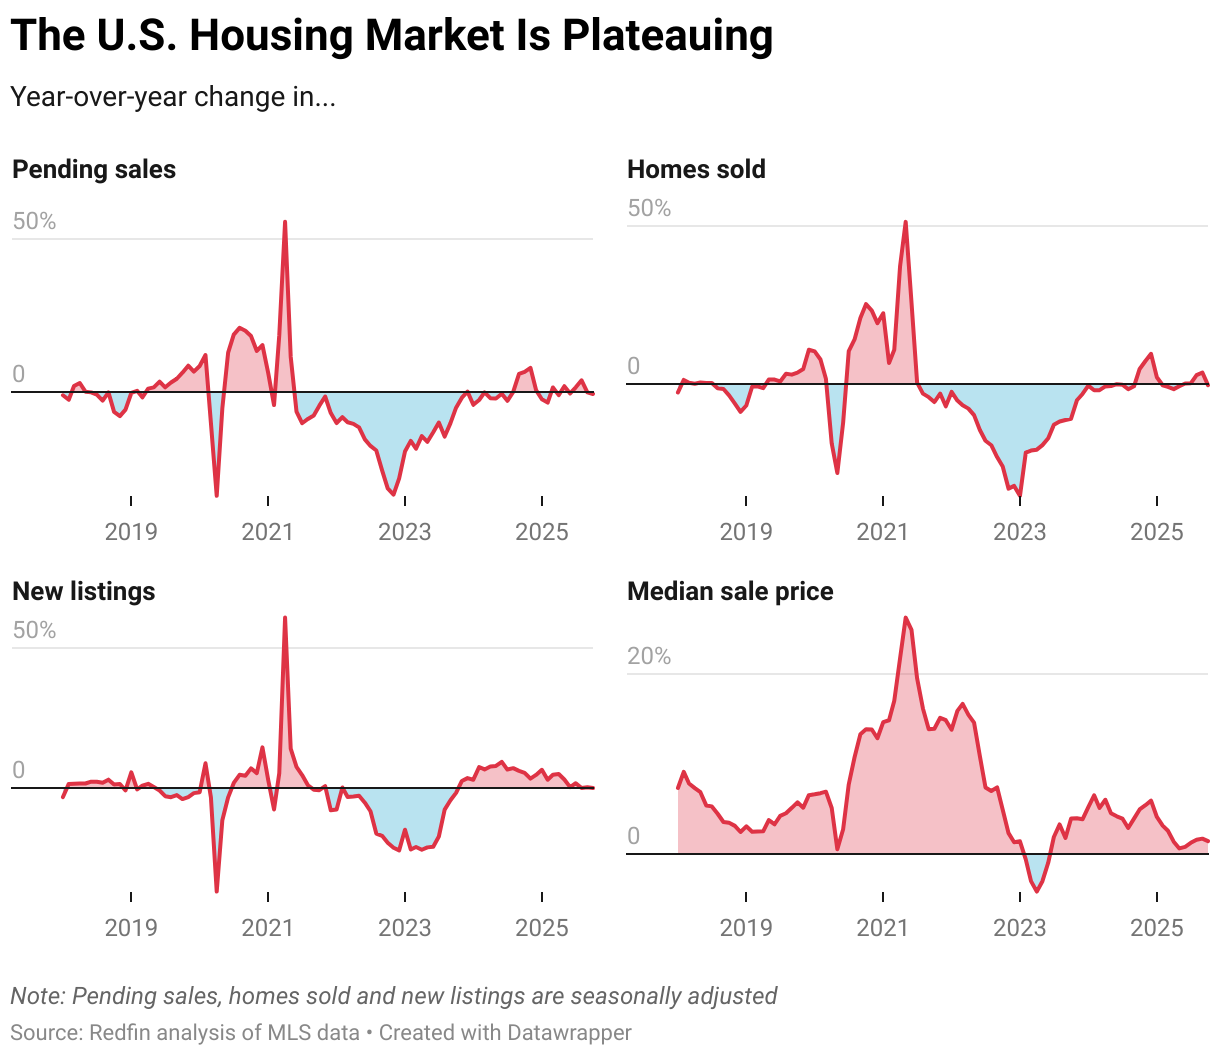
Pending home sales were little changed from both a month and a year earlier. So were closed home sales and new listings. Price growth has also shown signs of plateauing. The median home sale price rose 1.4% year over year to $440,523 in October. That pales in comparison to the big swings of 2020-2024, and even 2025; prices were up as much as 4.1% at the start of the year.
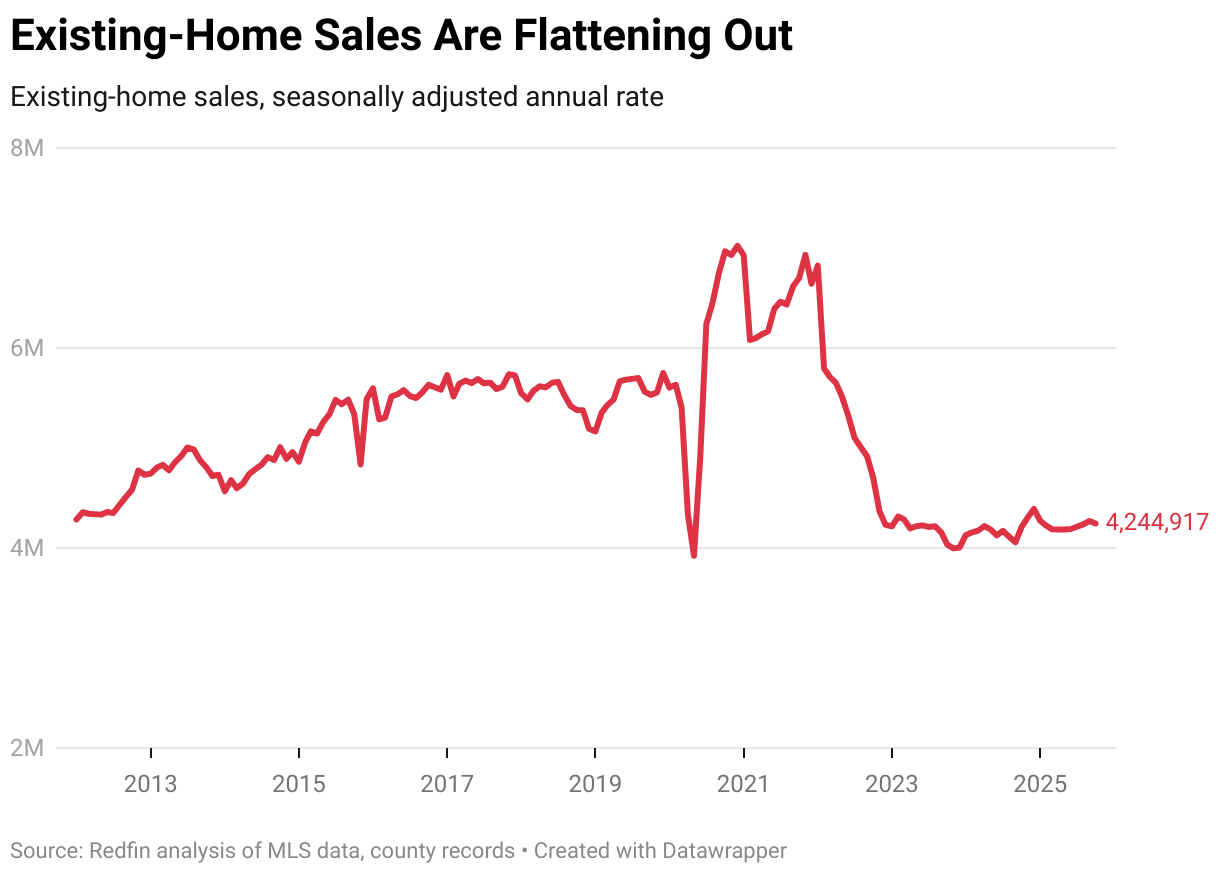
Existing-home sales are also flattening out. They came in at a seasonally adjusted annual rate of 4.24 million in October, little changed from both a month and a year earlier. Redfin economists expect existing-home sales to end the year roughly flat with 2024, which was the worst year for sales since 1995.
The housing market has been stagnating for a while, but this past year has been especially stagnant. For example, the low for pending sales over the past year was 477,141 in January and the high was 502,003 last November. That’s a gap of just 24,862—the smallest gap for any 12-month period since 2013. We see a similar trend when we look at new listings and prices.
“Many would-be homebuyers and sellers are paralyzed by high prices and economic uncertainty,” said Redfin Senior Economist Asad Khan. “Homebuying activity has stabilized at below-normal levels, and while selling activity has also slowed, there are still a lot more sellers in the market than buyers. That’s allowing the people who are moving ahead with home purchases to score discounts and other concessions from sellers.”
Redfin estimates there are roughly 500,000 more home sellers than buyers actively in the market, which means the buyers who are in the market hold the negotiating power. Redfin agents report that many of the people who are selling now are people who have to sell, be it for a job change, a divorce or another major life event.
October 2025 Housing Market Highlights: United States
| October 2025 | Month-over-month change | Year-over-year change | |
|---|---|---|---|
| Median sale price | $440,523 | 1.2% | 1.4% |
| Existing-home sales, seasonally adjusted annual rate | 4,244,917 | -0.6% | 0.9% |
| Pending home sales, seasonally adjusted | 490,156 | -0.1% | -0.6% |
| Homes sold, seasonally adjusted | 426,749 | -0.4% | -0.4% |
| New listings, seasonally adjusted | 539,705 | -0.4% | -0.1% |
| Total homes for sale, seasonally adjusted (active listings) | 1,966,633 | -0.5% | 6.8% |
| Months of supply | 3.3 | -0.1 | 0.1 |
| Median days on market | 51 | 0 | 7 |
| Share of homes that sold above final list price | 24.9% | -0.7 ppts | -2.9 ppts |
| Average sale-to-final-list-price ratio | 98.5% | -0.1 ppts | -0.4 ppts |
|
Pending sales that fell out of contract, as % of overall pending sales |
15.1% | 0.7 ppts |
0.8 ppts |
| Monthly average 30-year fixed mortgage rate | 6.25% | -0.1 ppts |
-0.18 ppts |
Note: Data are subject to revision
Homebuyers Are Scoring Bigger-Than-Normal Discounts
The typical home that sold in October went for 1.5% less than its final list price—the biggest October discount since 2019 and a reflection of today’s buyer’s market. Roughly one-quarter (24.9%) of homes that sold went for more than than their final list price—the lowest October share since 2019.
One reason sellers are offering discounts is that their homes are taking a long time to sell. The typical home that went under contract last month spent 51 days on the market. That’s seven days longer than a year earlier and represents the slowest October pace since 2016.
Homes are lingering on the market in part because there’s a mismatch in buyer and seller expectations. Some sellers are pricing high because they bought their home for top dollar during the pandemic and need to recoup their investment. But the reality is many buyers aren’t willing to pay top dollar because they simply can’t afford it, with mortgage rates more than twice the record low hit during the pandemic.
While mortgage rates remain much higher than they were in 2020 and 2021, they have ticked down in recent months and are hovering near the lowest level in about a year. But Redfin agents say many house hunters are waiting to jump into the market until rates fall even further.
October 2025 Metro-Level Highlights
The figures below are based on a list of the 50 most populous U.S. metropolitan areas. Some metros may be removed from time to time to ensure data accuracy. Refer to our metrics definition page for explanations of metrics used in this report. Metro-level data are not seasonally adjusted. All changes below represent year-over-year changes.
- Prices: Median sale prices rose most from a year earlier in the Midwest: Cleveland (11.6%), Newark, NJ (10.9%) and Detroit (10.4%) saw the biggest increases. The biggest declines were in Florida and Texas: Jacksonville (-4%), Dallas (-3.6%), and Atlanta (-2.5%). It’s worth noting that all three Bay Area metros—San Jose, San Francisco and Oakland—also posted declines.
- Pending home sales: Pending sales rose most in Florida: West Palm Beach (21.6%), Tampa (18.4%) and San Francisco (12%) posted the biggest increases. Please note that parts of Florida may be seeing large year-over-year jumps because hurricanes slowed the market down last October. Pending sales fell most in Seattle (-15.6%), Minneapolis (-9.8%) and San Antonio (-9.4%).
- Closed home sales: Home sales rose most in San Francisco (16.1%), Tampa (9.5%) and West Palm Beach (6.9%). They fell most in San Antonio (-16.1%), Las Vegas (-10.3%) and Philadelphia (-9.6%).
- New listings: New listings rose most in Tampa (15.9%), West Palm Beach (12.3%) and St. Louis (8.5%). They fell most in San Jose (-12.1%), Jacksonville (-10.4%) and Dallas (-8.8%).
- Active listings: Active listings rose most in Washington, D.C. (19.3%), Las Vegas (16.9%) and Baltimore (16.1%). They fell in just six metros, with the largest declines in San Francisco (-12.7%), San Jose (-10.8%) and Chicago (-2.9%).
- Sold above list price: In San Francisco, 58.5% of homes sold above their final list price—the highest share of any metro Redfin analyzed. Next came Newark (58%) and San Jose (54%) The lowest shares were in West Palm Beach (5.7%) Fort Lauderdale (6.8%) and Miami (7.1%).
- Days on market: In Miami, the typical home that went under contract did so in 96 days, up 27 days from a year earlier—the biggest increase among the metros Redfin analyzed. Next came Fort Lauderdale (+22 days) and Austin, TX (+18 days). Two metros saw decreases in days on market: Kansas City, MO (-5 days) and San Francisco (-2 days).
October 2025 Full Metro-Level Data
| U.S. metro area | Median sale price | Median sale price, Y/Y change | Pending sales, Y/Y change | Homes sold, Y/Y change | New listings, Y/Y change | Active listings, Y/Y change | Median days on market | Median days on market, Y/Y change |
|---|---|---|---|---|---|---|---|---|
| Anaheim, CA | $1,200,000 | 3.8% | -0.1% | 5.2% | -6.7% | 7.0% | 54 | 14 |
| Atlanta, GA | $385,000 | -2.5% | -4.5% | -2.7% | -5.0% | 5.2% | 64 | 13 |
| Austin, TX | $440,000 | 2.1% | 1.6% | -8.6% | 1.9% | 9.1% | 95 | 18 |
| Baltimore, MD | $405,000 | 3.9% | -5.0% | -6.0% | 0.4% | 16.1% | 37 | 5 |
| Boston, MA | $735,000 | 3.5% | -1.9% | -0.8% | 1.4% | 12.7% | 23 | 2 |
| Charlotte, NC | $415,000 | 3.8% | N/A | 1.8% | 6.5% | 14.9% | 68 | 15 |
| Chicago, IL | $367,000 | 7.9% | -1.6% | 2.8% | -0.5% | -2.9% | 54 | 0 |
| Cincinnati, OH | $305,000 | 6.3% | -3.0% | 1.5% | 5.3% | 7.7% | 43 | 2 |
| Cleveland, OH | $250,000 | 11.6% | 10.3% | 6.3% | 3.9% | 7.5% | 32 | 7 |
| Columbus, OH | $349,550 | 2.8% | 5.3% | 5.0% | 3.6% | 13.4% | 51 | 8 |
| Dallas, TX | $405,000 | -3.6% | -7.0% | -3.4% | -8.8% | 9.8% | 66 | 11 |
| Denver, CO | $580,000 | -2.0% | -8.4% | -3.5% | -8.8% | 5.8% | 46 | 10 |
| Detroit, MI | $209,700 | 10.4% | -7.4% | -8.4% | 4.5% | 13.4% | 28 | 3 |
| Fort Lauderdale, FL | $455,000 | -1.1% | 11.2% | 0.7% | -0.6% | 4.1% | 102 | 22 |
| Fort Worth, TX | $354,000 | -1.4% | -6.3% | -3.0% | -8.3% | 1.2% | 63 | 5 |
| Houston, TX | $331,482 | -1.1% | N/A | -0.6% | -2.6% | 11.2% | 66 | 16 |
| Indianapolis, IN | $310,000 | 4.0% | 0.3% | 5.7% | 2.8% | 11.5% | 27 | 3 |
| Jacksonville, FL | $360,000 | -4.0% | 4.8% | 2.3% | -10.4% | -1.3% | 86 | 16 |
| Kansas City, MO | $350,000 | 7.7% | N/A | 2.6% | 7.5% | 1.3% | 27 | -5 |
| Las Vegas, NV | $440,000 | -0.2% | -6.0% | -10.3% | -2.7% | 16.9% | 63 | 16 |
| Los Angeles, CA | $905,000 | 0.6% | -1.0% | 2.5% | -4.2% | 6.4% | 55 | 10 |
| Miami, FL | $550,000 | 0.0% | 7.0% | -1.8% | -0.1% | 7.0% | 96 | 27 |
| Milwaukee, WI | $355,000 | 9.2% | -0.5% | -1.4% | -3.5% | -0.1% | 44 | 1 |
| Minneapolis, MN | $390,000 | 1.6% | -9.8% | 0.3% | 0.0% | -0.3% | 31 | 0 |
| Montgomery County, PA | $490,000 | 3.2% | 2.2% | -3.5% | 7.2% | 6.5% | 32 | 3 |
| Nashville, TN | $489,945 | 6.1% | -0.9% | -3.0% | -2.8% | 11.0% | 71 | 10 |
| Nassau County, NY | $739,500 | 5.6% | -4.9% | 4.2% | -5.7% | 1.5% | 35 | 6 |
| New Brunswick, NJ | $562,500 | 2.3% | -2.0% | 3.5% | 0.5% | 5.9% | 43 | 7 |
| New York, NY | $760,000 | 3.3% | -5.1% | -4.9% | -3.0% | 5.6% | 60 | 6 |
| Newark, NJ | $610,000 | 10.9% | 1.0% | 6.7% | -1.1% | 12.0% | 36 | 10 |
| Oakland, CA | $925,000 | -0.5% | -6.0% | -3.4% | -2.6% | 5.4% | 25 | 6 |
| Orlando, FL | $410,000 | 0.0% | 7.0% | 5.3% | 1.5% | 3.3% | 64 | 15 |
| Philadelphia, PA | $295,000 | 5.4% | -0.1% | -9.6% | 5.3% | 4.5% | 44 | 2 |
| Phoenix, AZ | $460,000 | 0.0% | 5.8% | 3.6% | 3.9% | 10.5% | 67 | 12 |
| Pittsburgh, PA | $246,000 | 4.7% | 6.1% | 6.2% | 1.8% | 7.1% | 57 | 4 |
| Portland, OR | $545,000 | -1.4% | -3.6% | 0.9% | -2.0% | 9.1% | 41 | 7 |
| Providence, RI | $519,900 | 6.1% | -6.2% | -5.8% | 2.5% | 7.9% | 29 | 3 |
| Riverside, CA | $580,000 | -1.7% | 2.7% | 6.4% | -5.7% | 4.0% | 63 | 16 |
| Sacramento, CA | $590,000 | 1.2% | -1.4% | -1.7% | -7.2% | 8.0% | 42 | 14 |
| San Antonio, TX | $302,746 | -0.7% | -9.4% | -16.1% | -3.1% | 6.0% | 87 | 17 |
| San Diego, CA | $889,000 | -1.2% | -1.7% | 5.4% | -0.5% | 7.2% | 40 | 10 |
| San Francisco, CA | $1,550,000 | -1.6% | 12.0% | 16.1% | -2.7% | -12.7% | 17 | -2 |
| San Jose, CA | $1,600,000 | -2.1% | -5.9% | -2.8% | -12.1% | -10.8% | 17 | 1 |
| Seattle, WA | $840,000 | 0.0% | -15.6% | -9.1% | -6.3% | 11.7% | 25 | 9 |
| St. Louis, MO | $289,000 | 5.1% | N/A | 1.1% | 8.5% | 10.8% | 29 | 4 |
| Tampa, FL | $370,000 | -1.3% | 18.4% | 9.5% | 15.9% | 6.3% | 61 | 8 |
| Virginia Beach, VA | $363,900 | 4.0% | -8.1% | 1.0% | 0.3% | 6.2% | 38 | 2 |
| Warren, MI | $320,000 | 2.6% | -2.6% | -2.7% | 5.2% | 9.6% | 27 | 3 |
| Washington, DC | $589,000 | 4.9% | -4.3% | -4.0% | 5.2% | 19.3% | 44 | 10 |
| West Palm Beach, FL | $510,000 | 4.1% | 21.6% | 6.9% | 12.3% | 1.5% | 96 | 12 |