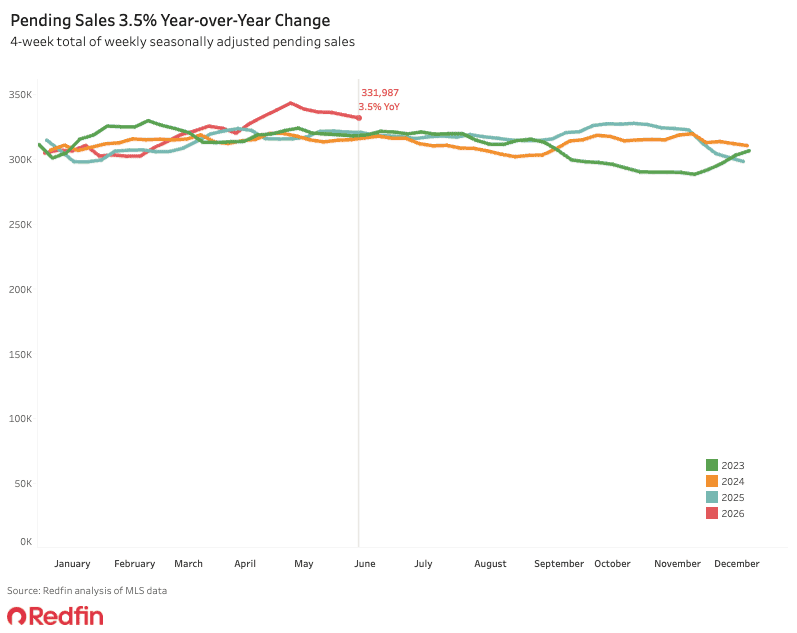
Pending home sales fell for the fifth week in a row, and new listings declined, too.
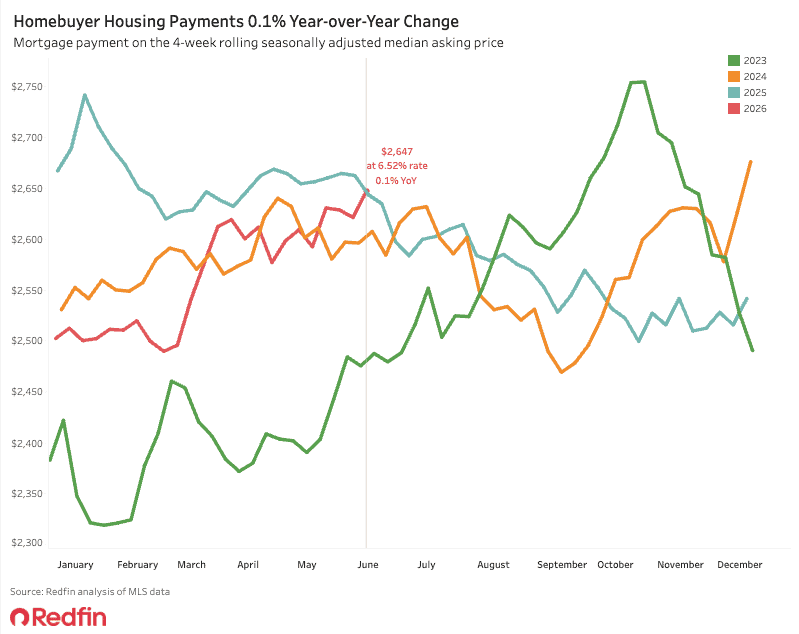
The median U.S. monthly housing payment hit $2,647 during the four weeks ending June 14, its highest level in a year and just about $100 shy of 2023’s all-time high.
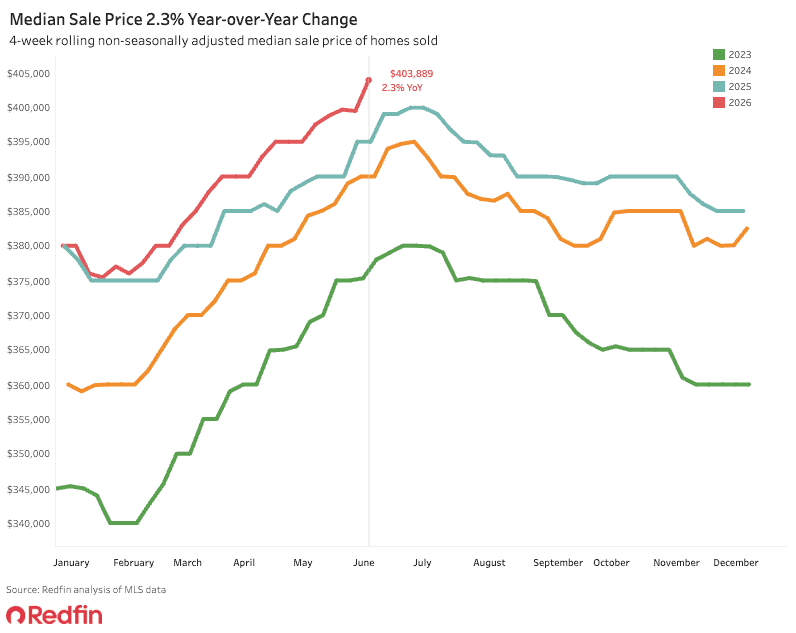
Housing payments are rising because both home-sale prices and mortgage rates remain stubbornly high. The median sale price rose 2.3% year over year to a record high of $403,889, and the weekly average mortgage rate is 6.52%, near its highest level in 10 months. The average daily rate dropped to 6.54% on Wednesday from 6.75% a month earlier in the wake of the newly announced peace deal with Iran.
High costs are pricing many would-be homebuyers out of the market, and widespread economic uncertainty is causing others to think twice before making a major purchase. That has pushed pending home sales down 0.6% week over week, the fifth straight week of declines.
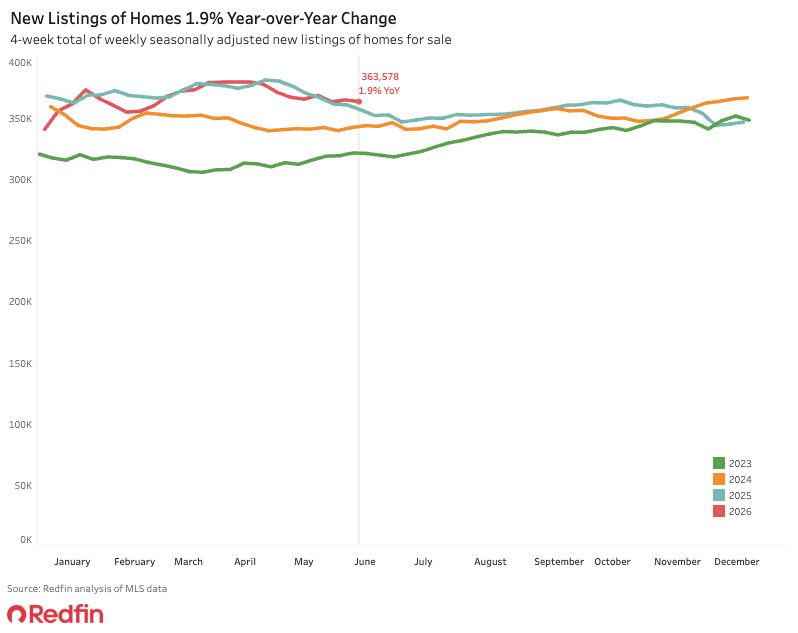
Some prospective sellers are backing off, too, as they notice dwindling demand. New listings fell 0.4% week over week, and the total number of homes for sale fell 0.1%.
With hundreds of thousands more home sellers than buyers nationwide, Redfin agents are advising sellers to price competitively. “A lot of sellers want to list higher than they should, and my biggest struggle is getting them to price with the market–or just below the market, if they want to create a frenzy,” said Dawn Kane, a Redfin Premier agent in Maryland and Pennsylvania. “Homes that just hit the market are typically the most popular, so pricing high and letting a home sit can stigmatize a listing. Don’t be the house priced at $1 million in a neighborhood where comparable homes are selling for $800,000-$900,000.”
For Redfin economists’ takes on the housing market, please visit Redfin’s “From Our Economists” page.
Leading indicators
| Indicators of homebuying demand and activity | ||||
| Value (if applicable) | Recent change | Year-over-year change | Source | |
| Daily average 30-year fixed mortgage rate | 6.55% (June 17) | Down from 6.68% a week earlier | Down from 6.88% | Mortgage News Daily |
| Weekly average 30-year fixed mortgage rate | 6.52% (week ending June 11) | Up from 6.48% a week earlier | Down from 6.84% | Freddie Mac |
| Mortgage-purchase applications (seasonally adjusted) | Down 3% from a week earlier (as of week ending June 12) | Up 3% | Mortgage Bankers Association | |
| Google searches of “homes for sale” | Down about 10% from a month earlier (as of June 15) | Up 12% | Google Trends | |
| Touring activity | Up 14% from the start of the year (as of June 13) | At this time last year, it was up 35% from the start of 2025 | ShowingTime | |
Key housing-market data
| U.S. highlights: Four weeks ending June 14, 2026
Redfin’s national metrics include data from 900+ U.S. metro areas and are based on homes listed and/or sold during the period. Weekly housing-market data goes back through 2021. Subject to revision. |
|||
| Four weeks ending June 14, 2026 | Year-over-year change | Notes | |
| Median sale price | $403,889 | 2.3% | |
| Median asking price (seasonally adjusted) | $405,651 | 2.7% | |
| Median monthly mortgage payment (seasonally adjusted) | $2,647 at a 6.52% mortgage rate | 0.1% | Highest level in a year |
| Pending sales (seasonally adjusted) | 331,987 | 3.5% | |
| New listings (seasonally adjusted) | 363,578 | 1.9% | |
| Active listings (seasonally adjusted) | 1,490,116 | 0.6% | |
| Months of supply | 3.4 | -0.2 pts. | 4 to 5 months of supply is considered balanced, with a lower number indicating seller’s market conditions |
| Share of homes off market in two weeks | 37.2% | Up from 37% | |
| Median days on market | 39 | +1 day | |
| Share of home listings with price drops | 19.4% | Down from about 21% | |
| Share of homes sold above list price | 28.4% | Essentially unchanged | |
| Average sale-to-list price ratio | 99.1% | Down slightly | |
|
Metro-level highlights: Four weeks ending June 14, 2026 Redfin’s metro-level data includes the 50 most populous U.S. metros. Select metros may be excluded from time to time to ensure data accuracy. |
|||
|---|---|---|---|
| Metros with biggest year-over-year increases | Metros with biggest year-over-year decreases |
Notes |
|
| Median sale price | San Francisco (10.4%)
Pittsburgh (9.3%) St. Louis (8.3%) Chicago (7.7%) Jacksonville, FL (7.6%) |
San Jose, CA (-5.3%)
Portland, OR (-2.4%) Seattle (-2%) San Antonio (-1.9%) Orlando, FL (-1.5%) |
Declined in 11 metros |
| Pending sales | West Palm Beach, FL (31.9%)
San Francisco (23.8%) Milwaukee (14.8%) Austin, TX (14.8%) Newark, NJ (12.5%) |
Houston (-11.9%)
Seattle (-11.8%) Detroit (-3.7%) Atlanta (-3.7%) Denver (-2.1%) |
|
| New listings | Boston (16.8%)
Montgomery County, PA (13.3%) Philadelphia (12.7%) St. Louis (11.5%) Chicago (10.5%) |
Dallas (-12.6%)
Indianapolis (-6.7%) Riverside, CA (-6.5%) San Antonio (-5%) Atlanta (-4.5%) |
|
Refer to our metrics definition page for explanations of all the metrics used in this report.