Five Charts That Show What’s Happening in the Housing Market Right Now
As the US housing market grows accustomed to a new reality under the coronavirus quarantine, homes are sitting on the market for longer and growth in home prices has hit zero

6 Charts That Show What’s Happening in the Housing Market Right Now
Six charts that illustrate the latest developments in the housing market as COVID-19 continues to upend residential real estate.
11 Charts That Show How the Coronavirus Is Impacting the Housing Market
The impacts of the coronavirus pandemic are rippling through nearly every segment of the economy and the housing market is no exception.

Going Into the Coronavirus Crisis, the U.S. Housing Market Was Stronger Than Ever
U.S. home-sale prices increased 6.6% year over year in February to a nationwide median of $293,700.

Home Prices Rose 7% in January, Housing Supply Fell 11%
U.S. home-sale prices increased 6.7% year over year in January to a median of $306,400 across the 217 metros Redfin tracks.
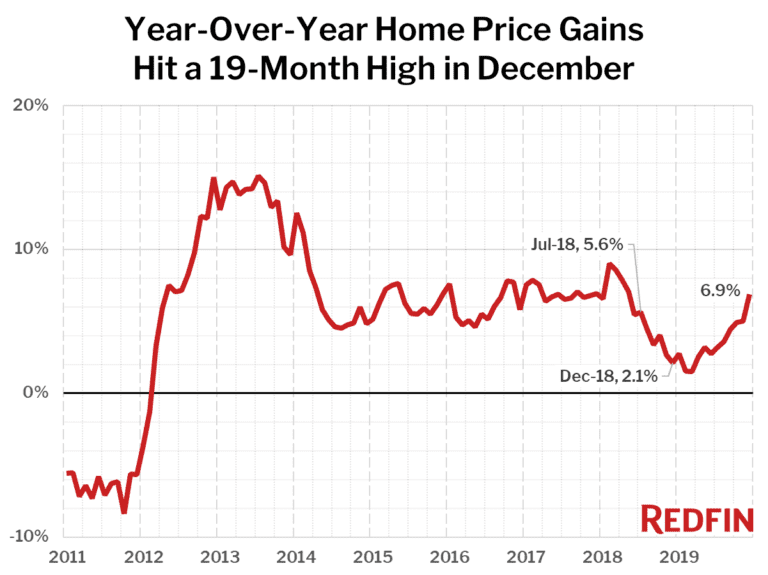
US Home Prices Up 7% in December
A record shortage of homes for sale drove prices up on a monthly and annual basis. U.S. home-sale prices increased 6.9% year over year in
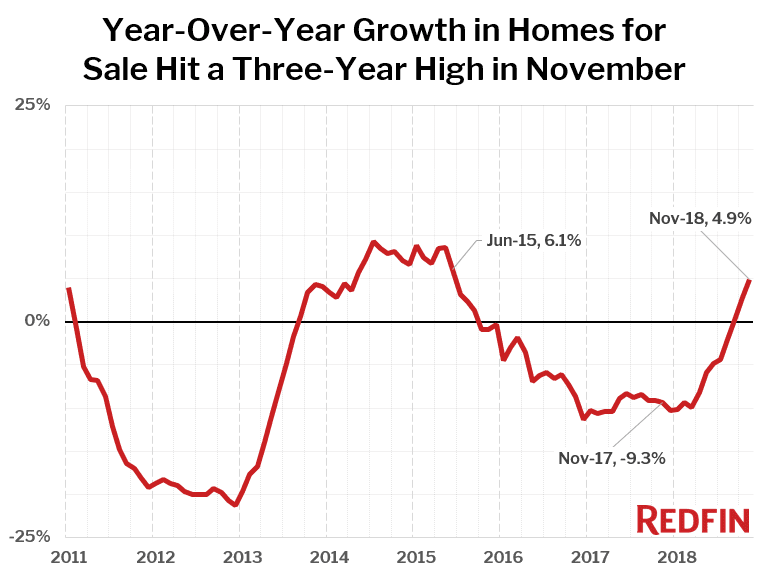
Housing Inventory Up 5% in November—Fastest Growth in 3 Years—as Sales Decline 8%
Prices post sub-4% growth for third consecutive month Balance of supply and demand is shifting toward homebuyers’ favor in markets like San Francisco, Seattle, Denver,
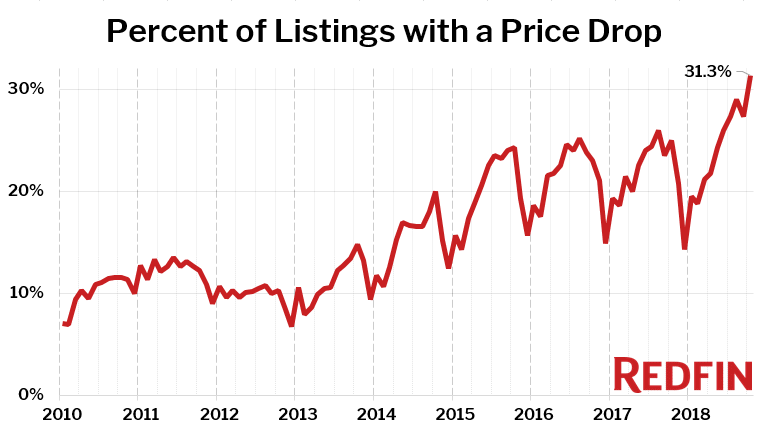
Nearly One in Three Homes For Sale in October had a Price Drop—Highest Level Since at Least 2010
Home Inventory Continues to Grow as Sales Decline 6% Year over Year U.S. home-sale prices increased 4.5 percent in October compared to a year ago,

Akron, Richmond and Buffalo Among the Eight Inland Housing Markets that are Heating Up as the Coasts Cool
While expensive coastal markets on the coasts like Seattle and San Jose are cooling off, with homes lingering on the market longer than this time

Housing Inventory Crunch Finally Subsides as Supply Posts First Annual Gain in Nearly Three Years
September Home Sales Slump, Prices Post Smallest Increase Since the Market Bottomed in 2012
Home Prices Up 4.7% in August, Lowest Price Growth in Four Years
August Home Sales Fell 2.4%, as Inventory Declined Just 3.4% from Last Year

Home Prices Up 5.3% in July, Continuing a Trend of Moderating Growth
San Jose, Seattle and Portland Posted Double-Digit Inventory Increases for the Second Month in a Row