
Five Charts That Show What’s Happening in the Housing Market Right Now
As the US housing market grows accustomed to a new reality under the coronavirus quarantine, homes are sitting on the market for longer and growth in home prices has hit zero

6 Charts That Show What’s Happening in the Housing Market Right Now
Six charts that illustrate the latest developments in the housing market as COVID-19 continues to upend residential real estate.
11 Charts That Show How the Coronavirus Is Impacting the Housing Market
The impacts of the coronavirus pandemic are rippling through nearly every segment of the economy and the housing market is no exception.

Going Into the Coronavirus Crisis, the U.S. Housing Market Was Stronger Than Ever
U.S. home-sale prices increased 6.6% year over year in February to a nationwide median of $293,700.

Home Prices Rose 7% in January, Housing Supply Fell 11%
U.S. home-sale prices increased 6.7% year over year in January to a median of $306,400 across the 217 metros Redfin tracks.
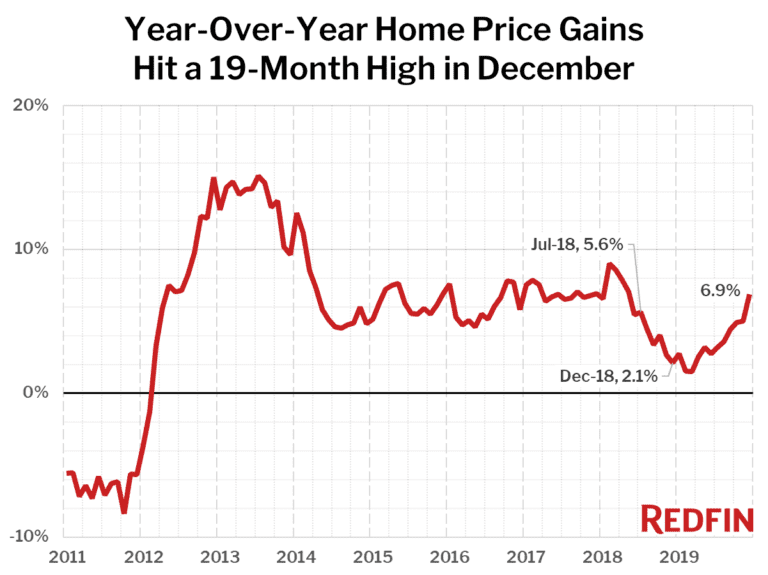
US Home Prices Up 7% in December
A record shortage of homes for sale drove prices up on a monthly and annual basis. U.S. home-sale prices increased 6.9% year over year in
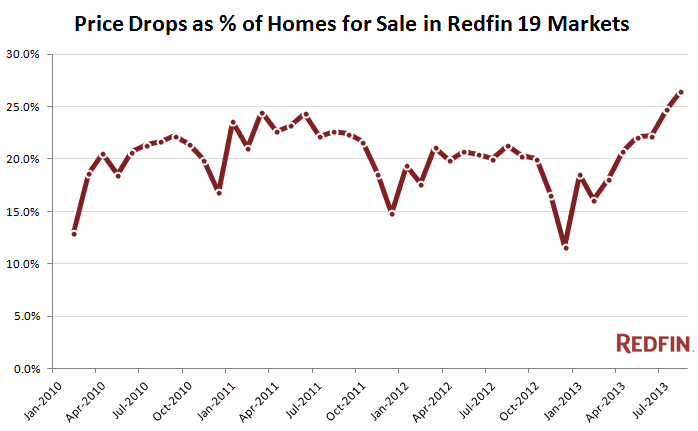
Summer Prices Cool as We Head Into Fall
Each month, Redfin takes a look at home price trends throughout 19 key US markets. This month shows the rapid rise in home prices and
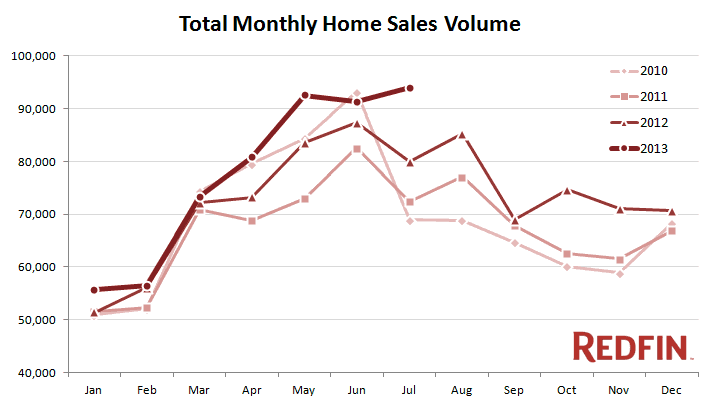
Inventory Drops While Sales and Prices Rise
Home prices continued their rise in July and sales volume jumped back up from the unexpected June dip. Price per square foot is up 19
Home Prices Shot Up in May As Sales Hit 4-Year High
May’s housing market has good news for everyone. Good news for buyers: For-sale home inventory increased in May for the second straight month. Good news

Sales Slip, Listings Plummet, but Home Prices Keep Rising as 2012 Concludes; Inventory Growth Key to 2013 Performance
Home prices, sales, and listings all fell between November and December as the housing market weathered the usually-slow holiday season with a smaller dip in prices than the same time a year ago. Listings continued to drop, falling to a level 33 percent below December 2011 and 44 percent below December 2010.

Redfin Real-Time Home Price Tracker: Home Prices Dip Slightly in September, Still 5% Above 2011
National home prices turned in another 5 percent gain from a year ago in September, even as they began their typical seasonal decline, inching down just under 1 percent from August.
Redfin Real-Time Home Price Tracker: Home Prices Hit Two-Year High in August, Up 5% From 2011
National home prices hit a two-year high in August, marking a 5% gain from August 2011 and holding steady month-over-month during a time of year that typically sees a seasonal decline in prices.