Despite high mortgage rates pushing down demand, historically low inventory keeps pushing up home prices, and therefore values. That’s good news for homeowners, but challenging for buyers.
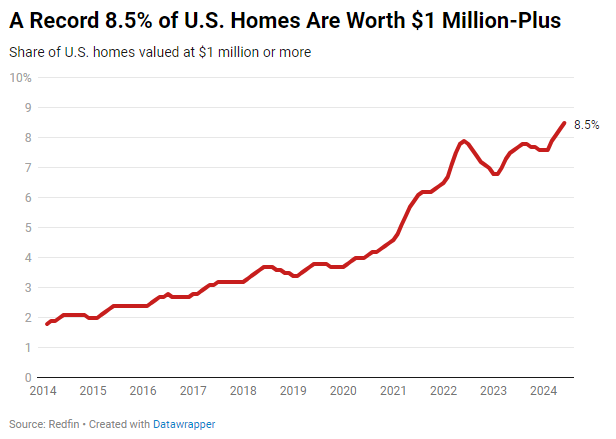
Nearly one in 10 (8.5%) U.S. homes are worth $1 million or more, the highest share of all time. That’s up from 7.6% a year ago and more than double the 4% share before the pandemic.
This analysis estimated current home values using the Redfin Estimate, public records and MLS data, and past home values using public records and MLS data. The figures in this report represent June 2024, unless otherwise noted. In raw numbers, 8,022,439 U.S. homes were worth at least $1 million in June 2024, compared to 7,155,393 in June 2023 and 3,427,869 in June 2019 (before the pandemic began).
The share of U.S. homes worth $1 million or more is at a record high because home prices are at a record high; the median sale price nationwide was up 4% year over year in June. While price growth has eased slightly since the start of 2024, prices have been rising on a year-over-year basis for the last year, pushing many homes over the million-dollar mark.
Prices are rising even more for homes that are already expensive: The median sale price of U.S. luxury homes rose 9% year over year to a record $1.18 million in the second quarter. Prices of luxury homes rising has an outsized impact on the share of homes worth at least $1 million because a major portion of them have long been on the cusp of hitting the million-dollar mark, and just did.
Prices are rising despite slow homebuying demand because of a supply shortage
Mortgage rates have been sitting at more than double pandemic-era lows since the start of 2022, pushing monthly housing costs to record highs and driving down home sales.
Soft demand would typically push home prices down, but prices have remained strong in the current market because a supply shortage is causing competition. While inventory has recently improved, it’s still about 30% below pre-pandemic levels because many homeowners are locked in by low rates.
For homeowners and sellers, a higher chance that their home is worth more than $1 million means more money in their real estate portfolio or in their pocket. But for prospective buyers, especially first-timers, the rising share of homes listed for seven figures makes it more difficult to afford a home.
“Home prices, insurance and mortgage rates have shot up so much that many people are either priced out of the market or weary of committing to such a high monthly payment,” said Julie Zubiate, a Redfin Premier agent in the Bay Area, where the majority of homes go for at least $1 million. “The people who are buying without hesitating are in tech and work at Google, Apple, Facebook or a similar company. Many Bay Area buyers–especially those without tech money–are getting more selective, jumping ship if a small problem comes up in, say, the inspection. They’re spending too much money to rationalize not getting everything on their must-have list.”
Buyers have caught a bit of a break recently, with declining mortgage rates upping their purchasing power by tens of thousands of dollars. Zubiate said the recent downward trend in mortgage rates is bringing some buyers back to the Bay Area market.
There are more million-dollar homes than a year ago nearly everywhere in the U.S.
The share of homes worth at least $1 million rose year over year in all but three of the 50 most populous U.S. metros. It fell in Austin, TX, where 10% of homes are now worth $1 million or more, down incrementally from 10.1% last year. It stayed the same in Indianapolis, IN (2%) and Houston (3.6%).
The share of homes worth seven figures isn’t increasing in Austin and Houston partly because rampant new construction in Texas has pushed up supply, putting a lid on price growth.
California, already home to the biggest share of million-dollar homes, is gaining them faster than anywhere else
Pricey California metros are gaining million-dollar homes faster than anywhere else in the U.S. In Anaheim, 58.8% of homes are now worth at least $1 million, up from 51% a year ago. The next-biggest increases are in San Diego (42.6%, up from 36.5%) and Los Angeles (39.3%, up from 35%). Those places are gaining seven-figure homes fast because the median home price in each of those metros is around $1 million, meaning there were a lot of homes poised to jump over the million-dollar mark.
California is also home to the metros with the most million-dollar homes. In both San Francisco and San Jose, about 80% of homes are worth seven figures, followed by Anaheim (58.8%).
The Bay Area has a much higher share of million-dollar-plus homes than anywhere else because it has the highest home prices in the country; the median sale price there is roughly $1.5 million.
There are still a handful of fairly inexpensive major metro areas where virtually no homes are worth $1 million. In Detroit, Cleveland, Pittsburgh and Kansas City, MO, less than 1% of homes are worth seven figures.
| Metro-level summary: Share of homes worth at least $1 million
50 most populous U.S. metros |
|||
| U.S. metro area | Share of homes worth at least $1 million, June 2024 | Share of homes worth at least $1 million, June 2023 | Share of homes worth at least $1 million, YoY change (in percentage points) |
| Anaheim, CA | 58.80% | 51.00% | 7.80 |
| Atlanta, GA | 4.60% | 4.10% | 0.50 |
| Austin, TX | 10.00% | 10.10% | -0.10 |
| Baltimore, MD | 3.60% | 3.10% | 0.50 |
| Boston, MA | 23.80% | 20.60% | 3.20 |
| Charlotte, NC | 4.90% | 4.30% | 0.6 |
| Chicago, IL | 3.70% | 3.10% | 0.6 |
| Cincinnati, OH | 1.50% | 1.20% | 0.3 |
| Cleveland, OH | 0.80% | 0.70% | 0.1 |
| Columbus, OH | 1.50% | 1.20% | 0.3 |
| Dallas, TX | 6.40% | 6.20% | 0.2 |
| Denver, CO | 11.30% | 10.90% | 0.4 |
| Detroit, MI | 0.50% | 0.40% | 0.1 |
| Fort Lauderdale, FL | 7.70% | 7.10% | 0.6 |
| Fort Worth, TX | 3.30% | 3.20% | 0.1 |
| Houston, TX | 3.60% | 3.60% | 0.0 |
| Indianapolis, IN | 2.00% | 2.00% | 0.0 |
| Jacksonville, FL | 4.60% | 4.40% | 0.2 |
| Kansas City, MO | 0.90% | 0.80% | 0.1 |
| Las Vegas, NV | 3.90% | 3.30% | 0.6 |
| Los Angeles, CA | 39.30% | 35.00% | 4.3 |
| Miami, FL | 14.80% | 13.30% | 1.5 |
| Milwaukee, WI | 2.00% | 1.60% | 0.4 |
| Minneapolis, MN | 2.80% | 2.50% | 0.3 |
| Montgomery County, PA | 5.10% | 4.30% | 0.8 |
| Nashville, TN | 7.70% | 7.20% | 0.5 |
| Nassau County, NY | 19.20% | 17.20% | 2.0 |
| New Brunswick, NJ | 12.00% | 9.20% | 2.8 |
| New York, NY | 30.50% | 27.00% | 3.5 |
| Newark, NJ | 12.40% | 9.60% | 2.8 |
| Oakland, CA | 48.10% | 45.90% | 2.2 |
| Orlando, FL | 3.60% | 3.30% | 0.3 |
| Philadelphia, PA | 2.60% | 2.30% | 0.3 |
| Phoenix, AZ | 7.40% | 6.70% | 0.7 |
| Pittsburgh, PA | 0.90% | 0.80% | 0.1 |
| Portland, OR | 7.30% | 6.90% | 0.4 |
| Providence, RI | 3.00% | 2.30% | 0.7 |
| Riverside, CA | 7.20% | 6.20% | 1.0 |
| Sacramento, CA | 8.90% | 7.90% | 1.0 |
| San Antonio, TX | 2.30% | 2.20% | 0.1 |
| San Diego, CA | 42.60% | 36.50% | 6.1 |
| San Francisco, CA | 80.60% | 76.40% | 4.2 |
| San Jose, CA | 80.10% | 76.30% | 3.8 |
| Seattle, WA | 34.40% | 30.20% | 4.2 |
| St. Louis, MO | 1.30% | 1.10% | 0.2 |
| Tampa, FL | 5.10% | 4.80% | 0.3 |
| Virginia Beach, VA | 3.10% | 2.60% | 0.5 |
| Warren, MI | 1.70% | 1.40% | 0.3 |
| Washington, DC | 13.10% | 11.10% | 2.0 |
| West Palm Beach, FL | 14.20% | 13.00% | 1.2 |