Home-purchase agreements are canceled at the highest rate in San Antonio, where sellers outnumber buyers two to one–giving buyers the upper hand and plenty of choices.
Nearly 40,000 home-sale agreements nationwide were canceled in January, equal to 13.7% of homes that went under contract that month. That’s up from 13.1% a year earlier, and the highest January share in records dating back to 2017.
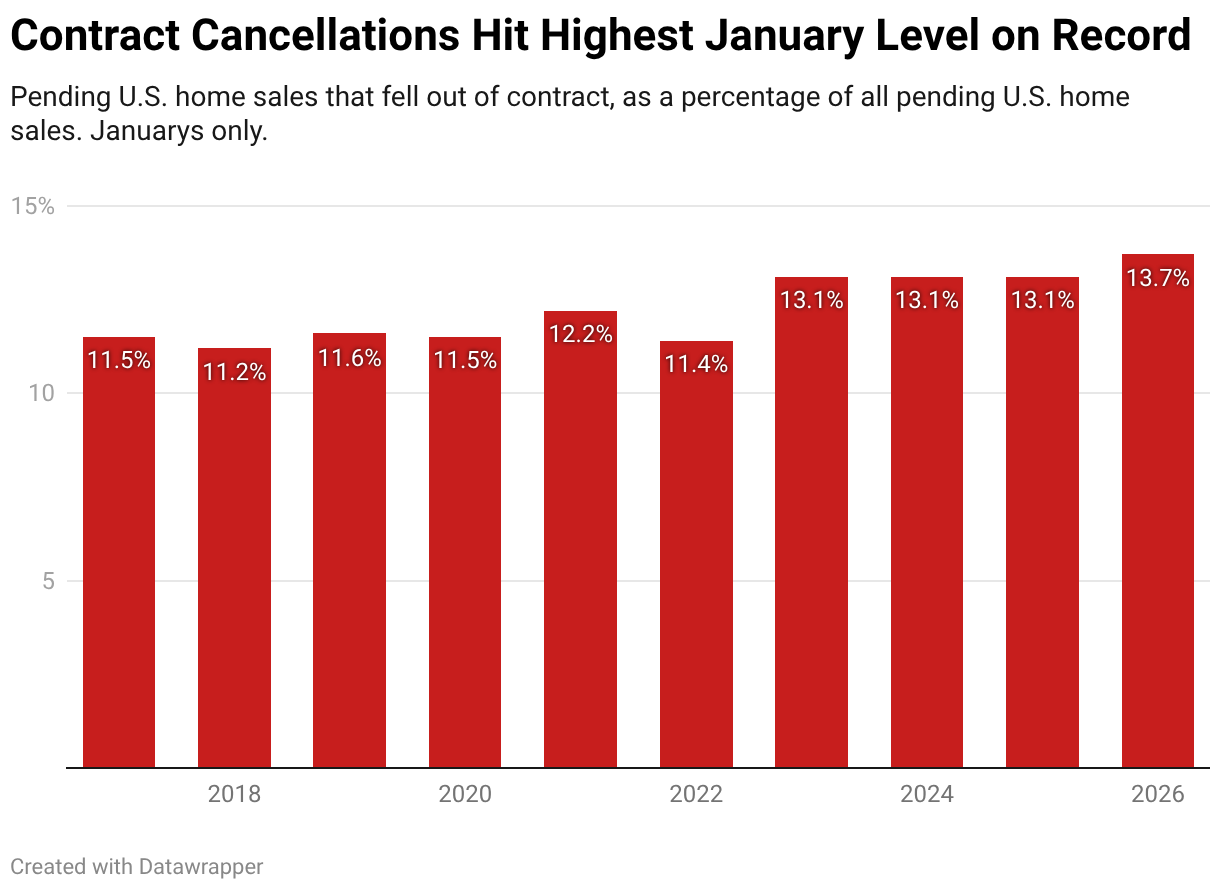
This is based on a Redfin analysis of MLS pending-sales data. The data is seasonal; typically, there’s a higher share of cancellations at the end of the year and a lower share in the spring. That’s why we compare this January to past Januarys. Please note: Homes that fell out of contract during a given month didn’t necessarily go under contract that same month. This data is subject to revision.
Sales are falling through at a higher rate than in the past largely because it’s a buyer’s market, with hundreds of thousands more U.S. home sellers than buyers. That gives buyers negotiating power; they may back out during the inspection period if they see a home they like better or an inspection issue arises.
Another major reason buyers are backing out of deals is financial uncertainty. While housing costs have come down from their peak, they are still near historic highs. Some would-be buyers are canceling purchases because they’re getting jittery about buying a house when they’re anxious about things like layoffs, tariffs and geopolitical tensions.
“More buyers are backing out,” said Alin Glogovicean, a Redfin Premier agent in Los Angeles, where 16.7% of home purchase agreements were cancelled in January, up from 15% a year earlier. “They’re second-guessing the wisdom of making a huge purchase when there’s a fear in the back of their mind about the state of the economy and the uncertainty of their finances. That’s particularly true when they’re first-time buyers who don’t have equity from a previous home sale, and they’re using most or all of their savings on a down payment.”
San Antonio, Atlanta Have the Highest Cancellation Rates, Bay Area Has the Lowest
In San Antonio, more than one in five (21.2%) home-purchase agreements were canceled in January, the highest share of the 47 major U.S. metros Redfin analyzed. It’s followed by Atlanta (18.5%) and Cleveland (17.9%). Riverside, CA (17.5%) and Orlando, FL (17.3%) round out the top five.
Cancellations are especially common in those places largely because they’re mostly buyer’s markets, with many more home sellers than buyers, giving buyers the option to back out of deals and move on to the next house. In San Antonio, for instance, there are twice as many sellers as buyers, and in Atlanta, there are 80% more.
On the other end of the spectrum, just 3.5% of home-purchase agreements in San Francisco were canceled in January, the lowest share of the metros Redfin analyzed. It’s followed by Nassau County, NY (4.8%), San Jose, CA (5.3%), Milwaukee (7.6%) and Oakland, CA (8.4%).
Contract Cancellations Are on the Rise in Most Metros
Contract cancellations increased most in San Antonio, rising from 15.6% last January to 21.2% this year. Next come Cleveland (17.9%, up from 14.9%) and San Jose, CA (5.3%, up from 2.9%).
The share of home-purchase cancellations fell year over year in 11 of the metros in this analysis. The biggest decline was in Tampa, FL (15.1%, down from 17%). It’s followed by Milwaukee (7.6%, down from 9.3%) and Nassau County, NY (4.8%, down from 6.4%).
| Metro-Level Summary: Canceled Home-Purchase Agreements, January 2026
47 of the most populous U.S. metro areas Redfin analyzed the 50 most populous metro areas, and included the 47 with sufficient data |
||
| U.S. metro area | Jan. 2026: Pending sales that fell out of contract, as % of overall pending sales | Jan. 2025: Pending sales that fell out of contract, as % of overall pending sales |
| Anaheim, CA | 13.4% | 11.4% |
| Atlanta, GA | 18.5% | 17.1% |
| Austin, TX | 13.3% | 13.2 % |
| Baltimore, MD | 12.8 % | 12.2% |
| Boston, MA | 10.4% | 10.5% |
| Chicago, IL | 13.2% | 14.2% |
| Cincinnati, OH | 11.9% | 12.2% |
| Cleveland, OH | 17.9% | 14.9% |
| Columbus, OH | 14.9% | 13.4% |
| Dallas, TX | 15.1% | 14.3% |
| Denver, CO | 15.1% | 14.6% |
| Detroit, MI | 15.5% | 16.2% |
| Fort Lauderdale, FL | 15.8% | 15.7% |
| Fort Worth, TX | 15.6% | 15.3% |
| Houston, TX | 16.6% | 14.5% |
| Indianapolis, IN | 13.4% | 12.9% |
| Jacksonville, FL | 17.3% | 16.1% |
| Las Vegas, NV | 16.8 % | 16.0% |
| Los Angeles, CA | 16.7 % | 15.0% |
| Miami, FL | 15.1 % | 13.6% |
| Milwaukee, WI | 7.6% | 9.3% |
| Minneapolis, MN | 9.2% | 10.0% |
| Montgomery County, PA | 8.7% | 8.3% |
| Nashville, TN | 13.5% | 11.9% |
| Nassau County, NY | 4.8% | 6.4% |
| New Brunswick, NJ | 12.3% | 10.6 % |
| New York, NY | 8.9% | 8.6% |
| Newark, NJ | 12.5% | 11.5% |
| Oakland, CA | 8.4% | 6.2% |
| Orlando, FL | 17.3 % | 17.4% |
| Philadelphia, PA | 12.0% | 11.4% |
| Phoenix, AZ | 14.5% | 15.2% |
| Pittsburgh, PA | 12.8% | 11.9% |
| Portland, OR | 13.7% | 13.3% |
| Providence, RI | 10.8% | 11.7% |
| Riverside, CA | 17.5% | 16.4% |
| Sacramento, CA | 13.3% | 13.1% |
| San Antonio, TX | 21.2% | 15.6% |
| San Diego, CA | 13.8% | 12.6% |
| San Francisco, CA | 3.5% | 2.8% |
| San Jose, CA | 5.3% | 2.9% |
| Seattle, WA | 10.0% | 7.8% |
| Tampa, FL | 15.1% | 17.0% |
| Virginia Beach, VA | 14.5% | 13.1% |
| Warren, MI | 12.5% | 10.3% |
| Washington, DC | 11.9% | 11.5% |
| West Palm Beach, FL | 12.8% | 12.0% |
| National—U.S.A. | 13.7% | 13.1% |