The biggest increase was in Austin, where rents surged 40% from a year earlier.
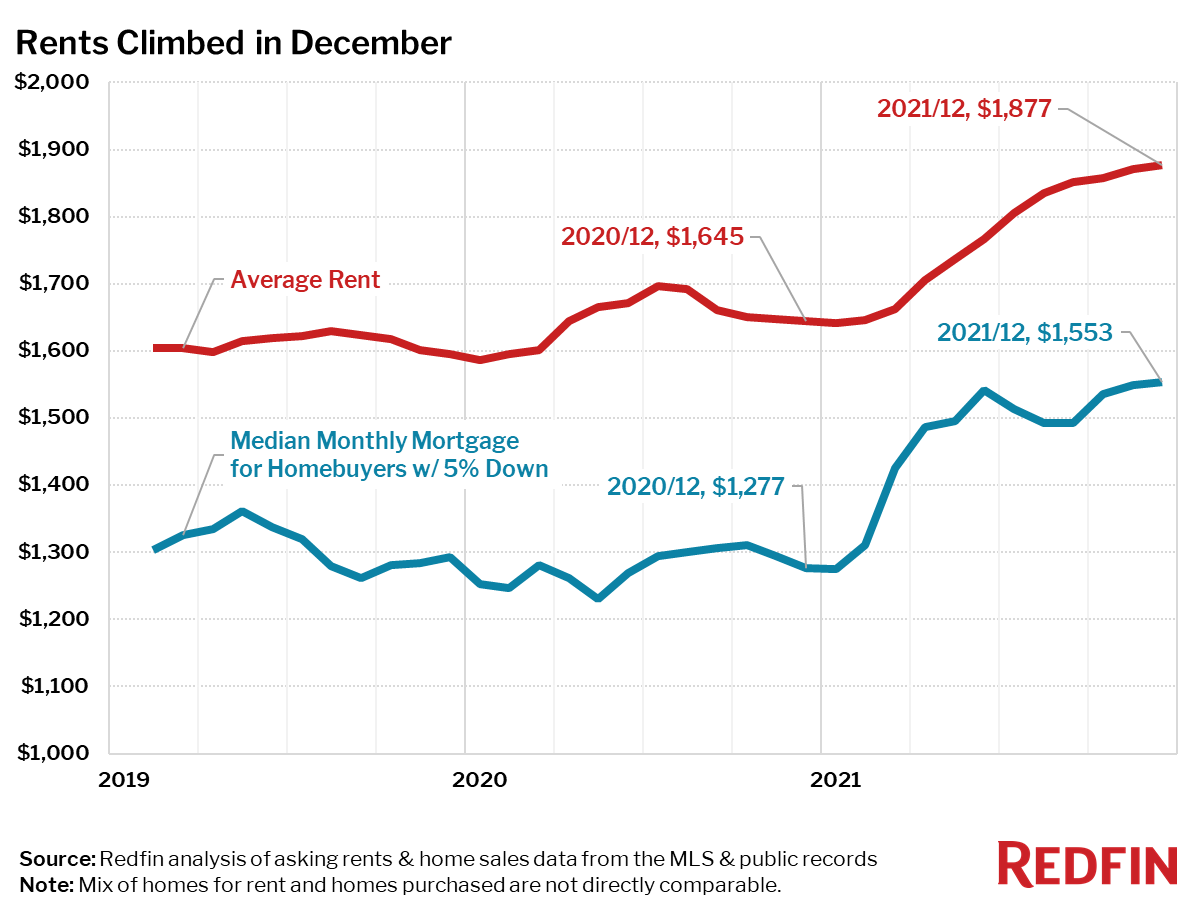
Average monthly listed rents in the U.S. increased 14.1% year over year to $1,877 in December, the largest annual jump since at least February 2019—the earliest month in Redfin’s rental data. Meanwhile, the national monthly mortgage payment for homebuyers climbed 21.6% year over year, also the biggest increase in Redfin’s records.
“The growth in mortgage payments has been driven by both climbing prices and climbing mortgage rates,” said Redfin Chief Economist
Daryl Fairweather. “And those rising mortgage costs push more potential homebuyers into renting instead, which pushes up demand and prices for rentals. Mortgage rate increases are accelerating, which will cause both mortgage payments and rent to grow throughout 2022.”
| Rental Market Summary |
December 2021 |
Month-Over-Month |
Year-Over-Year |
| Average Monthly Rent |
$1,877 |
0.3% |
14.1% |
| Median Monthly Mortgage Payment for Homebuyers w/ 5% down payment |
$1,553 |
0.3% |
21.6% |
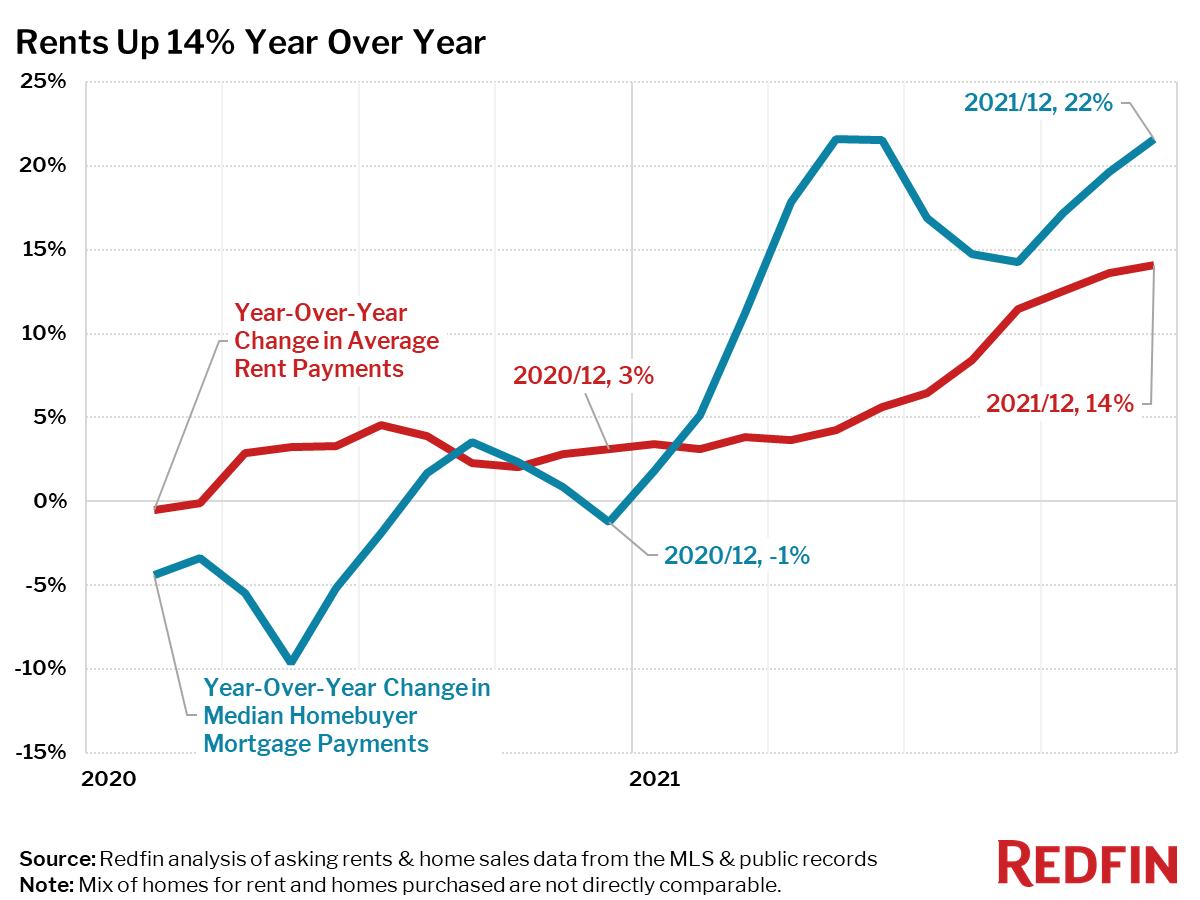
Year–over-year rent-price increases outpaced year-over-year mortgage payment increases for new homebuyers in just 16 of the 50 largest U.S. metro areas in December.
Rents are Up Over 30% In Many Major Metro Areas
The 10 metro areas with the biggest increases in rent prices—up 29% year over year or more—were almost exclusively on the East Coast. The only exceptions were
Austin, TX and
Portland, OR.
Top 10 Metro Areas With Fastest-Rising Rents Year Over Year
- Austin, TX (40%)
- Nassau County, NY (35%)
- New York, NY (35%)
- Newark, NJ (35%)
- New Brunswick, NJ (35%)
- Miami, FL (34%)
- West Palm Beach, FL (34%)
- Fort Lauderdale, FL (34%)
- Jacksonville, FL (31%)
- Portland, OR (29%)
Only Kansas City saw rent decline year over year
- Kansas City, MO (-0.8%)
Just one metro area saw rents fall in December from the same month a year earlier. Rents declined 0.8% in
Kansas City, MO.
Year-Over-Year Change in Rents and Median Monthly Mortgage Payments for Homebuyers, December 2021
| Region | Average Rent | Year-Over-Year Change in Average Rent | Monthly Mortgage (5% down) | Year-Over-Year Change in Monthly Mortgage (5% down) | Difference Between Year-Over-Year Change in 5% Down Mortgage Payment & Rent |
| Anaheim, CA | $3,394 | 9.6% | $3,813 | 24.0% | 14 pts |
| Atlanta, GA | $2,016 | 12.1% | $1,420 | 29.6% | 18 pts |
| Austin, TX | $2,290 | 39.9% | $1,956 | 37.5% | -2 pts |
| Baltimore, MD | $2,018 | 10.7% | $1,318 | 11.0% | 0 pts |
| Boston, MA | $3,637 | 22.3% | $2,511 | 18.8% | -3 pts |
| Charlotte, NC | $1,730 | 11.5% | $1,448 | 27.1% | 16 pts |
| Chicago, IL | $2,351 | 9.0% | $1,168 | 14.3% | 5 pts |
| Cincinnati, OH | $1,473 | 24.2% | $957 | 15.1% | -9 pts |
| Cleveland, OH | $1,378 | 11.6% | $730 | 9.8% | -2 pts |
| Columbus, OH | $1,458 | 7.5% | $1,095 | 16.3% | 9 pts |
| Dallas, TX | $2,081 | 28.5% | $1,562 | 27.0% | -1 pts |
| Denver, CO | $2,661 | 19.0% | $2,191 | 26.1% | 7 pts |
| Detroit, MI | $1,552 | 11.4% | $710 | 19.1% | 8 pts |
| Fort Lauderdale, FL | $3,020 | 34.0% | $1,481 | 23.5% | -11 pts |
| Fort Worth, TX | $2,081 | 28.5% | $1,367 | 30.8% | 2 pts |
| Houston, TX | $1,807 | 10.4% | $1,294 | 23.8% | 13 pts |
| Indianapolis, IN | $1,280 | 9.1% | $1,014 | 19.9% | 11 pts |
| Jacksonville, FL | $1,625 | 31.5% | $1,298 | 25.3% | -6 pts |
| Kansas City, MO | $1,391 | -0.8% | $1,116 | 18.5% | 19 pts |
| Las Vegas, NV | $1,820 | 25.2% | $1,620 | 31.7% | 7 pts |
| Los Angeles, CA | $3,394 | 9.6% | $3,387 | 20.7% | 11 pts |
| Miami, FL | $3,020 | 34.0% | $1,785 | 29.0% | -5 pts |
| Milwaukee, WI | $1,731 | 9.7% | $1,005 | 14.5% | 5 pts |
| Minneapolis, MN | $1,860 | 9.0% | $1,359 | 14.1% | 5 pts |
| Montgomery County, PA | $2,233 | 13.2% | $1,562 | 16.1% | 3 pts |
| Nashville, TN | $1,872 | 13.9% | $1,663 | 31.1% | 17 pts |
| Nassau County, NY | $3,718 | 34.5% | $2,333 | 13.4% | -21 pts |
| New Brunswick, NJ | $3,718 | 34.5% | $1,724 | 16.5% | -18 pts |
| New York, NY | $3,718 | 34.5% | $2,596 | 14.5% | -20 pts |
| Newark, NJ | $3,718 | 34.5% | $1,866 | 14.2% | -20 pts |
| Oakland, CA | $3,520 | 15.0% | $3,554 | 14.2% | -1 pts |
| Orlando, FL | $2,050 | 28.8% | $1,444 | 29.6% | 1 pts |
| Philadelphia, PA | $2,233 | 13.2% | $1,051 | 13.9% | 1 pts |
| Phoenix, AZ | $2,107 | 26.0% | $1,766 | 35.1% | 9 pts |
| Pittsburgh, PA | $1,707 | 8.9% | $820 | 11.0% | 2 pts |
| Portland, OR | $2,392 | 29.4% | $2,069 | 19.6% | -10 pts |
| Providence, RI | $2,176 | 13.1% | $1,542 | 20.5% | 7 pts |
| Riverside, CA | $2,666 | 18.5% | $2,150 | 24.9% | 6 pts |
| Sacramento, CA | $2,582 | 20.7% | $2,224 | 21.8% | 1 pts |
| San Antonio, TX | $1,386 | 11.5% | $1,252 | 25.3% | 14 pts |
| San Diego, CA | $3,077 | 10.8% | $3,142 | 23.9% | 13 pts |
| San Francisco, CA | $3,520 | 15.0% | $6,038 | 16.4% | 1 pts |
| San Jose, CA | $3,300 | 6.7% | $5,550 | 21.3% | 15 pts |
| Seattle, WA | $2,724 | 20.9% | $2,949 | 23.4% | 3 pts |
| St. Louis, MO | $1,448 | 1.3% | $901 | 13.8% | 13 pts |
| Tampa, FL | $2,076 | 28.1% | $1,371 | 31.2% | 3 pts |
| Virginia Beach, VA | $1,681 | 20.4% | $1,156 | 12.1% | -8 pts |
| Warren, MI | $1,552 | 11.4% | $1,043 | 13.0% | 2 pts |
| Washington, D.C. | $2,538 | 12.0% | $1,978 | 14.4% | 2 pts |
| West Palm Beach, FL | $3,020 | 34.0% | $1,582 | 20.4% | -14 pts |
| National | $1,877 | 14.1% | $1,553 | 21.6% | 7 pts |
Methodology
Redfin’s rent-versus-own analysis uses data from more than 20,000 apartment buildings across the US. The report combines rental data on all sizes of apartments for rent with home sales data on all residential home sales (single-family, townhouse and condos) from public records and the multiple listing service (MLS). When this report refers to the median mortgage payment for new homebuyers, it is based on a 5% down payment, the median sale price during the month and the average mortgage interest rate for the month. The report uses a 5% down payment in order to be comparable to what an average renter may be able to reasonably achieve in savings.
Redfin analyzed home sales data from the MLS, and public records and rent prices from RentPath, across the 50 largest metro areas in the US. Monthly rental prices in this report are not directly comparable to monthly homebuyer mortgage payments, since the mix of homes available to rent and the mix of homes being purchased differ in location, size and quality of home within each metro area. For example, most of the homes being purchased may be in the less expensive suburbs of the metropolitan area, while the apartments being rented may be closer to the more expensive city core.
It is also important to note that the prices in this report reflect the current costs of new leases and new mortgages during each time period. In other words, the amount shown as the average rent is not the average of what all renters are paying, but the average cost of apartments that were available for new renters during the report month. Likewise, the median monthly mortgage payment shown is only for homes that sold during the report month, not for all homeowners.