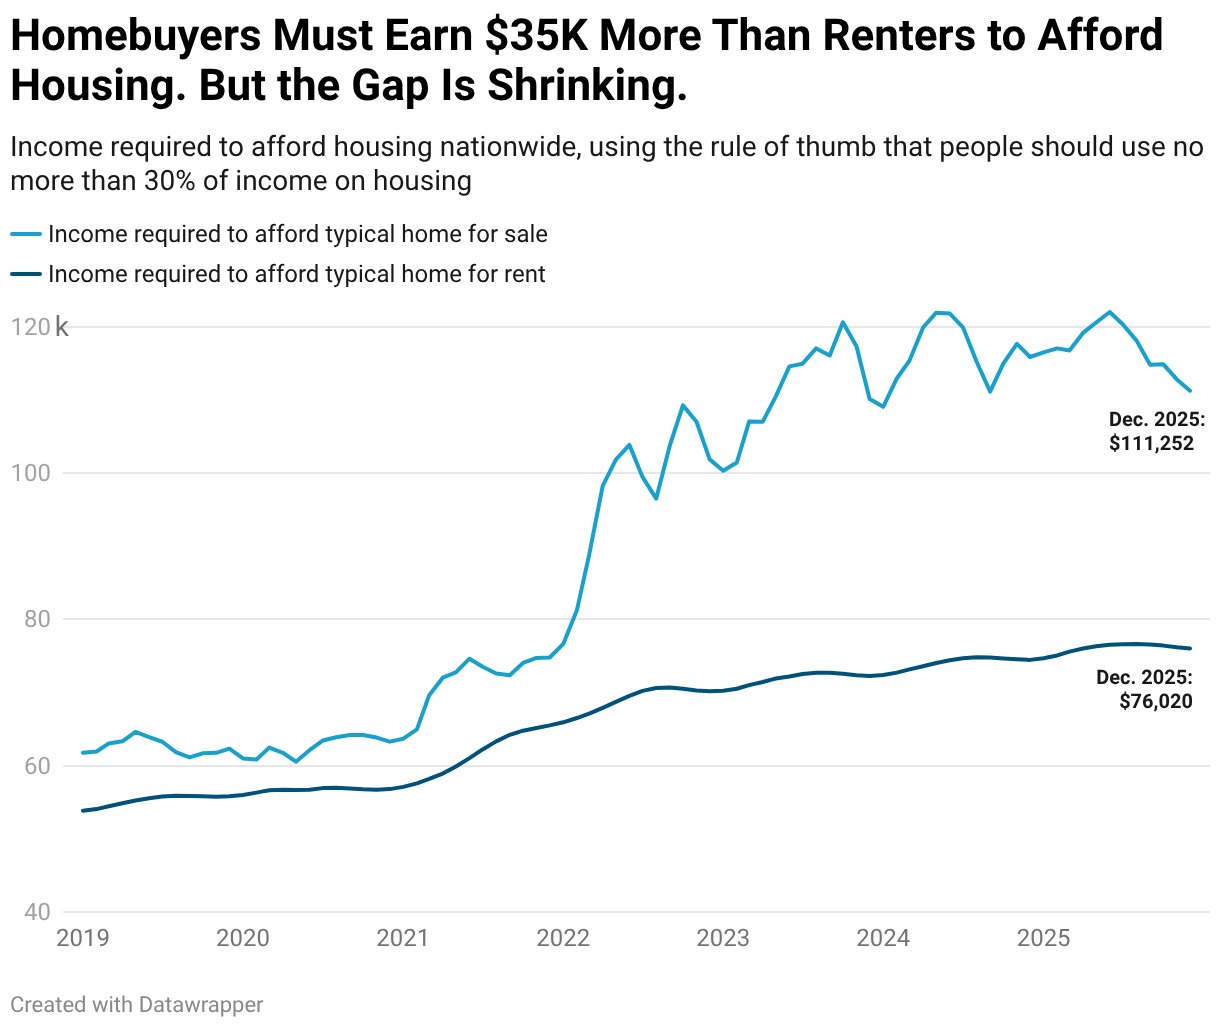
- Homebuyers need to earn $111,000 annually to afford the median-priced home, compared with $76,000 for renters. The median household income is $86,000.
- While that’s a significant gap, the rent-versus-buy gap is the smallest it has been in 3 years. It’s narrowing as buying gets slightly more affordable and renting gets slightly more expensive.
- Zooming in, the rent-versus-buy gap is shrinking in every major metro except Detroit. It’s narrowing most in San Jose, Sacramento and Seattle.
Americans need to earn $111,252 per year to afford the typical U.S. home for sale. That’s 46.3% more than the $76,020 they need to afford the typical rental.
While that’s a significant gap, it’s the smallest it has been in three years. A year ago, a family would have needed $115,870 annually to afford the typical home listing, 55.6% more than the $74,464 required for the typical rental. The gap peaked at 66.2% ($120,609 needed to buy, versus $72,572 needed to rent) in late 2023.
We consider a home affordable if a buyer or renter spends no more than 30% of their income on their monthly housing payment. This report focuses on December 2025—the most recent period for which data is available—and comparable periods in past years. Please see the end of this report for more on methodology.
The income needed to afford the typical home is still much higher than what the typical American earns. The median U.S. household income is an estimated $86,185, roughly $25,000 less than the amount necessary to afford a home. But the gap is narrowing: the median income rose 4% from 2024 to 2025, while the income needed to afford a home fell. The gap between the income needed to buy a home and the typical American’s earnings was roughly $33,000 in 2024, $8,000 more than 2025’s gap.
On the renting side, the typical household earns about $10,000 more than what they need ($76,020) to afford the typical rental. So while the income required to afford a rental has ticked up, the typical American family can still afford a rental.
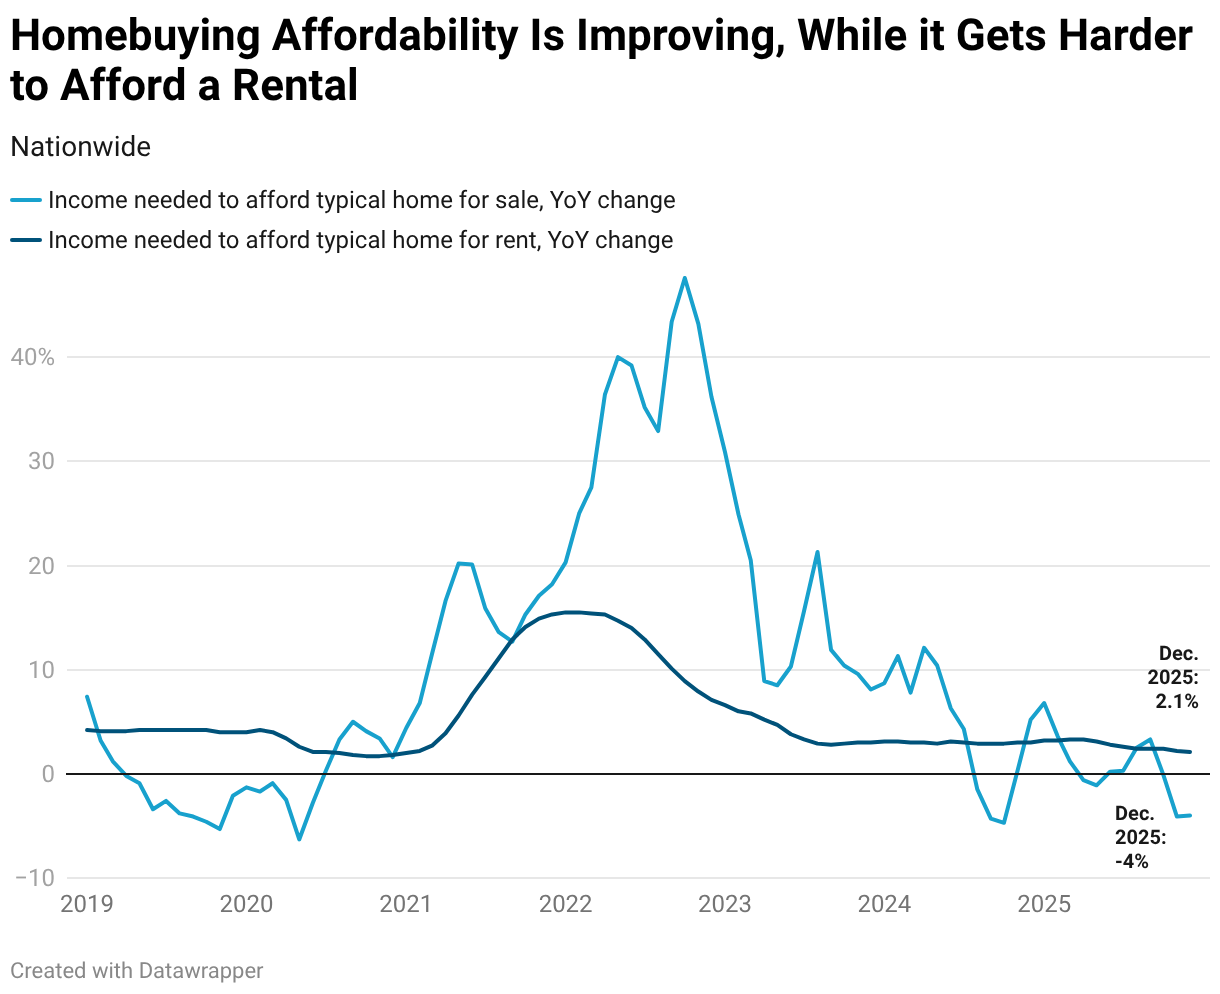
Homebuying Affordability Is Improving
The gap between the income needed to buy a home and the income needed to rent is shrinking because homebuying costs have declined on a year-over-year basis. At the same time, rental costs have risen.
- Monthly housing costs are lower than they were a year ago. The median home-sale price is $426,747, just slightly higher than last year, but average mortgage rates are sitting around 6.1%, down from nearly 7% last year. That makes the median monthly mortgage payment around $2,675, down from roughly $2,800 a year ago. The annual income required to buy a home dropped 4% year over year in December.
- Rental costs, meanwhile, are higher than they were a year ago. The median asking rent nationwide is $1,901, just $15 shy of August’s all-time high and up 2.1% year over year. That means the income required to rent is also up 2.1% year over year. But with wages rising at a faster rate, 3.7% year over year, rental affordability has improved slightly.
One reason housing costs are falling: Buyers have the upper hand. With hundreds of thousands more homebuyers than sellers in the market, much of the country is firmly in a buyer’s market, allowing house hunters to negotiate prices down and get concessions. Buyers are scoring bigger discounts than they have in the last decade.
“Many Americans have been hesitant to jump from renting to buying due to high homeownership costs, but the recent drop in mortgage rates and rise in homebuyer negotiating power may help some take the leap,” said Grishma Bhattarai, a Redfin economist. “We expect homebuying affordability to gradually improve in the coming year as mortgage rates stay closer to 6% than 7%, home-price growth loses steam and wages rise faster than housing costs.”
While rental costs are still rising on a year-over-year basis, they have started to decline month over month. Rental affordability could notably improve if current trends persist.
In the Bay Area, Buying Is Nearly 3 Times More Expensive Than Renting
In San Jose, CA, a buyer needs to earn $374,241 per year to afford the typical home for sale, 175% more than the income needed to afford rent. That’s the biggest premium among the metros in this analysis. It’s followed by neighboring San Francisco, where buyers must earn $291,256, which is 138% more than they need to rent. Rounding out the top three is Seattle, where buyers must earn $192,503, more than double (120%) the income needed to rent.
Those are all among the most expensive places to live in the country. Renting in those places is expensive, too, but the cost of renting pales in comparison to the cost of buying. In San Jose, for instance, today’s average monthly mortgage payment is over $9,000, while the typical asking rent is $3,399.
Buying requires a higher income than renting in every major metro area, but the premium is smallest in Pittsburgh, New Orleans, and Cleveland–all places where the median home sale price is under $300,000.
In Pittsburgh, someone must earn $66,168 to buy the typical home, just 13.1% more than the $58,505 they’d need for the typical rental. A New Orleans buyer would need to earn $74,566, which is 18.4% more than the income required to rent, and in Cleveland, they’d need to make $66,725, which is 20.8% more than what they’d need to rent.
The Rent-Versus-Buy Affordability Gap Is Shrinking in Every Major Metro–Except Detroit
A San Jose buyer needs to earn 175% more than a San Jose renter, down from 207% a year ago. That 31-percentage-point decline is the biggest among the metros in this analysis, though even with the decline, the rent-versus-buy gap is the biggest in the country.
The next-biggest declines are in Sacramento, CA, where a buyer needs to earn 67% more than a renter, down from 83% last year, and Seattle , where a buyer needs to earn 120% more than a renter, down from 136% last year. Two other California metros round out the top five: San Francisco (138% more, down from 152%), and Los Angeles (115%, down from 130%).
Detroit is the only major metro where the buying-over-renting premium has increased year over year. A Detroit buyer needs an annual income of $74,912 to afford the typical home for sale, 28.2% more than what’s needed for the typical rental. That’s up from 27% a year ago.
Rental Affordability Is Improving in Just 5 Metro Areas
The income needed to rent has increased in all but five of the 50 most populous metro areas. It has fallen in Austin, TX, Denver, San Antonio, Tampa, FL, and Phoenix.
In Austin, renters must earn $62,721 to afford the median-priced rental, which costs $1,568. That’s down 2.8%. Denver renters need $74,260 to afford the typical $1,856 rental, down 1.3%. San Antonio, (-0.8% to $54,477), Tampa (-0.8% to $79,980) and Phoenix (-0.5% to $69,122) all posted declines of less than 1%.
In all those metros except Tampa, the typical family earns more than necessary to afford a rental. In Tampa, it’s close: The median income is $78,452, compared to $79,980 to afford a rental.
Homebuying Affordability Is Improving in Most Metro Areas
The income needed to afford to buy a home has declined in 37 of the 50 most populous metro areas. This separate Redfin report delves into metro-level homebuying affordability. Among the highlights: Affordability improved most in Dallas and Sacramento, CA, and homebuying is most out of reach in coastal California.
| Metro-Level Summary: Homebuying and Rental Affordability, and Year-Over-Year Change
December 2025 50 most populous U.S. CSBAs (core-based statistical area) |
||||||||
| U.S. metro area | Median home-sale price | Income required to afford typical home for sale | Income required to afford typical home for sale, YoY | Median monthly asking rent | Income required to afford typical rental | Income required to afford typical rental, YoY | Premium needed to afford typical home vs. rental | Premium needed to afford typical home vs. rental, YoY |
| Atlanta, GA | $385,000 | $102,054 | -4.8% | $1,819 | $72,745 | 2.3% | 40.3% | -10.6% |
| Austin, TX | $432,000 | $129,868 | -5.7% | $1,568 | $62,721 | -2.8% | 107.1% | -6.4% |
| Baltimore, MD | $397,000 | $106,047 | -1.0% | $1,871 | $74,858 | 2.6% | 41.7% | -5.1% |
| Birmingham, AL | $292,400 | $73,030 | -3.4% | $1,375 | $54,985 | 1.8% | 32.8% | -7.1% |
| Boston, MA | $707,113 | $190,354 | -2.7% | $2,990 | $119,594 | 2.1% | 59.2% | -7.9% |
| Buffalo, NY | $270,000 | $79,919 | 2.7% | $1,367 | $54,662 | 2.7% | 46.2% | -0.1% |
| Charlotte, NC | $411,000 | $104,642 | -0.4% | $1,716 | $68,633 | 1.0% | 52.5% | -2.1% |
| Chicago, IL | $348,732 | $105,440 | 3.5% | $2,052 | $82,071 | 5.2% | 28.5% | -2.2% |
| Cincinnati, OH | $302,010 | $81,487 | 1.7% | $1,521 | $60,850 | 2.3% | 33.9% | -0.8% |
| Cleveland, OH | $230,000 | $66,725 | -1.8% | $1,381 | $55,220 | 4.4% | 20.8% | -7.6% |
| Columbus, OH | $340,000 | $92,935 | -1.5% | $1,446 | $57,822 | 2.3% | 60.7% | -6.2% |
| Dallas, TX | $377,379 | $112,175 | -7.4% | $1,642 | $65,684 | 0.3% | 70.8% | -14.1% |
| Denver, CO | $570,000 | $145,010 | -5.0% | $1,856 | $74,260 | -1.3% | 95.3% | -7.8% |
| Detroit, MI | $271,412 | $74,912 | 3.6% | $1,461 | $58,443 | 2.7% | 28.2% | 1.2% |
| Hartford, CT | $375,000 | $109,337 | 1.1% | $1,830 | $73,187 | 3.3% | 49.4% | -3.3% |
| Houston, TX | $335,000 | $100,005 | -2.2% | $1,617 | $64,678 | 0.0% | 54.6% | -3.6% |
| Indianapolis, IN | $310,000 | $82,052 | -2.1% | $1,494 | $59,776 | 3.7% | 37.3% | -8.2% |
| Jacksonville, FL | $370,000 | $97,898 | -5.9% | $1,659 | $66,357 | 0.4% | 47.5% | -9.8% |
| Kansas City, MO | $337,487 | $90,370 | -1.1% | $1,448 | $57,928 | 4.4% | 56.0% | -8.7% |
| Las Vegas, NV | $445,000 | $111,088 | -2.9% | $1,723 | $68,925 | 0.4% | 61.2% | -5.6% |
| Los Angeles, CA | $970,307 | $248,307 | -4.4% | $2,885 | $115,401 | 2.2% | 115.2% | -14.8% |
| Louisville, KY | $275,950 | $72,089 | 0.9% | $1,350 | $53,982 | 1.7% | 33.5% | -1.0% |
| Memphis, TN | $289,000 | $73,401 | 1.1% | $1,401 | $56,038 | 1.9% | 31.0% | -1.0% |
| Miami, FL | $502,398 | $133,999 | -4.2% | $2,652 | $106,067 | 0.6% | 26.3% | -6.4% |
| Milwaukee, WI | $330,500 | $91,724 | 0.3% | $1,433 | $57,303 | 4.3% | 60.1% | -6.4% |
| Minneapolis, MN | $383,000 | $103,665 | -1.8% | $1,675 | $67,008 | 4.4% | 54.7% | -9.9% |
| Nashville, TN | $463,250 | $115,215 | -3.8% | $1,765 | $70,582 | 0.5% | 63.2% | -7.3% |
| New Orleans, LA | $290,000 | $74,566 | -2.1% | $1,575 | $62,986 | 0.3% | 18.4% | -2.8% |
| New York, NY | $699,496 | $196,544 | 0.4% | $3,225 | $129,014 | 4.7% | 52.3% | -6.5% |
| Oklahoma City, OK | $265,000 | $69,078 | -1.5% | $1,334 | $53,377 | 2.9% | 29.4% | -5.7% |
| Orlando, FL | $400,000 | $105,887 | -4.3% | $1,934 | $77,343 | 0.5% | 36.9% | -6.8% |
| Philadelphia, PA | $385,274 | $107,012 | 1.2% | $1,850 | $74,014 | 3.1% | 44.6% | -2.6% |
| Phoenix, AZ | $469,000 | $115,987 | -3.7% | $1,728 | $69,122 | -0.5% | 67.8% | -5.5% |
| Pittsburgh, PA | $240,000 | $66,168 | 0.8% | $1,463 | $58,505 | 4.0% | 13.1% | -3.6% |
| Portland, OR | $545,000 | $144,235 | -2.9% | $1,793 | $71,712 | 1.0% | 101.1% | -8.0% |
| Providence, RI | $500,000 | $134,379 | 0.1% | $2,075 | $83,001 | 5.1% | 61.9% | -8.2% |
| Raleigh, NC | $429,840 | $112,043 | -4.8% | $1,667 | $66,674 | 0.2% | 68.0% | -8.8% |
| Richmond, VA | $395,000 | $101,427 | -5.3% | $1,651 | $66,047 | 3.1% | 53.6% | -13.6% |
| Riverside, CA | $585,000 | $152,255 | -3.9% | $2,477 | $99,096 | 1.9% | 53.6% | -9.3% |
| Sacramento, CA | $565,000 | $148,102 | -6.8% | $2,212 | $88,477 | 2.1% | 67.4% | -16.0% |
| Salt Lake City, UT | $544,900 | $137,568 | -0.9% | $1,600 | $63,994 | 0.7% | 115.0% | -3.4% |
| San Antonio, TX | $310,000 | $91,124 | -4.5% | $1,362 | $54,477 | -0.8% | 67.3% | -6.4% |
| San Diego, CA | $900,000 | $231,151 | -2.0% | $2,889 | $115,549 | 1.3% | 100.0% | -6.7% |
| San Francisco, CA | $1,115,640 | $291,256 | -0.5% | $3,066 | $122,643 | 5.7% | 137.5% | -14.9% |
| San Jose, CA | $1,457,500 | $374,241 | -5.9% | $3,399 | $135,969 | 4.9% | 175.2% | -31.4% |
| Seattle, WA | $731,810 | $192,503 | -4.2% | $2,185 | $87,409 | 2.6% | 120.2% | -15.5% |
| St. Louis, MO | $275,000 | $73,984 | 3.0% | $1,400 | $56,016 | 3.6% | 32.1% | -0.9% |
| Tampa, FL | $385,000 | $102,032 | -2.2% | $2,000 | $79,980 | -0.8% | 27.6% | -1.9% |
| Virginia Beach, VA | $365,000 | $95,773 | -1.4% | $1,782 | $71,277 | 5.4% | 34.4% | -9.3% |
| Washington, DC | $577,138 | $153,209 | -0.3% | $2,343 | $93,721 | 0.7% | 63.5% | -1.7% |
| United States | $426,747 | $111,252 | -4.0% | $1,901 | $76,020 | 2.1% | 46.3% | -9.3 |
Methodology
We consider a home affordable if a buyer or renter spends no more than 30% of their income on their monthly housing payment. This report focuses on December 2025—the most recent period for which data is available—and comparable periods in past years.
The buy-to-rent premium is defined as the ratio of income needed to afford a typical home to the income needed to afford a typical apartment. In this report, the word “homebuyer” refers to someone who is taking out a loan to finance their purchase.
The income needed to afford the typical home is calculated using the prevailing median home sale price and average mortgage-interest rate, and assumes a 15% down payment. The typical housing payments noted in this report include the mortgage principal, interest, property taxes, homeowners’ insurance and mortgage insurance. The 2025 median household income is estimated using the U.S. Census Bureau’s (ACS) 2024 median household income and 12-month moving average nominal wage growth rates compiled from the Current Population Survey and reported by the Federal Reserve Bank of Atlanta.
The income needed to afford typical rent is calculated using Zillow’s Observed Rent Index (ZORI) monthly data. ZORI is a repeat-rent index of the typical observed market rent that falls into the 35th to 65th percentile range across a given region, and is weighted to the rental housing stock to ensure representativeness across the entire market, not just those homes currently listed for-rent.