- A record 33% of U.S. rentals are in large multifamily buildings, while 31% are single-family homes—a record low.
- As recently as 2021, single-family homes made up the largest share of America’s rental stock.
- Just 14% of single-family homes are occupied by renters, the lowest share in records dating back to 2011.
- One reason multifamily rentals are on the rise: America has built a lot of them, lowering costs for renters.
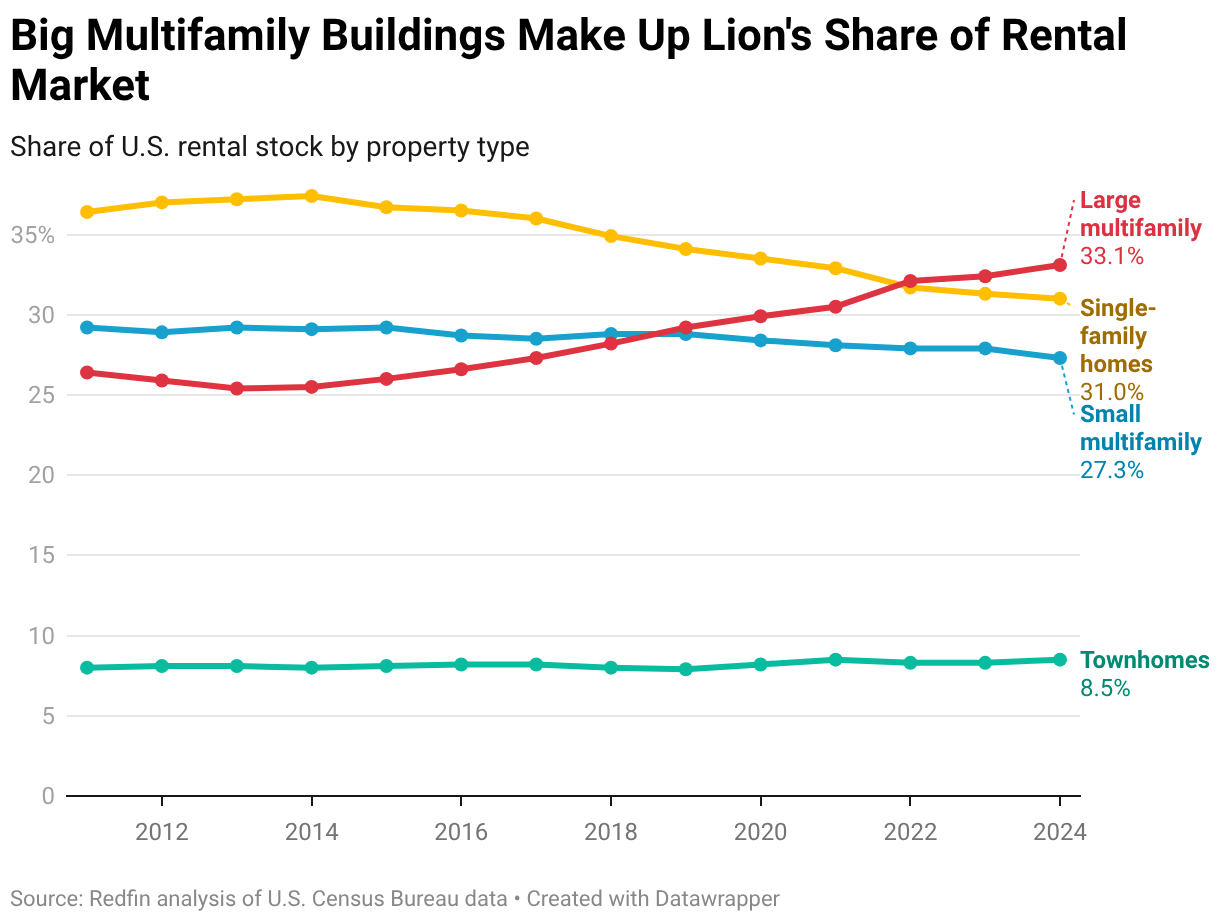
The most common type of rental housing in America is large multifamily buildings, but only in recent years did this become the case.
Roughly one of every three (33.1%) renter-occupied housing units in America is located in a large multifamily building—the highest share in records dating back to 2011. By comparison, 31% of rentals are single-family homes—the lowest share on record. Units in small multifamily buildings make up 27.3% of the nation’s rental stock, and townhomes make up 8.5%.
Large multifamily buildings surpassed single-family homes as the most common type of rental housing in 2022, when multifamily construction was on the rise during the pandemic moving frenzy.
This report is based on a Redfin analysis of U.S. Census Bureau data through 2024—the most recent year for which data are available. A large multifamily building is defined as a building with 20+ units, and a small multifamily building is one with 5-19 units. Single-family homes are defined as one-unit detached structures and townhouses are defined as one-unit attached structures. This analysis covers total rental stock, i.e., rentals that were both on and off the market.
Construction of both multifamily housing and single-family homes has generally been on the rise since the aftermath of the Great Recession, but multifamily construction has grown at a faster clip—especially during the pandemic. Rental demand jumped during the pandemic moving frenzy, and ultra-low interest rates made it easier for builders to construct more rentals to accommodate that demand. Rental housing is often an attractive option for investors because it can offer higher cash flows, diversified revenue streams, potential for scale, and tax benefits. Some cities have made it easier to build multifamily housing in recent years.
“Big apartment buildings make up a growing piece of the rental-market pie because America has been building a lot of them, which has made them more affordable for renters,” said Redfin Senior Economist Asad Khan. “Increased supply gives renters more options and more room to negotiate prices. While multifamily construction has slowed recently, there are still more apartments for rent than people who want to rent them, which has kept rent growth at bay.”
Construction of large multifamily buildings hit a record in 2024. Meanwhile, single-family-home construction remains below levels seen during the early 2000s housing bubble, and most of the single-family homes that are built go to homebuyers, not renters.

“Record-low mortgage rates during the pandemic drove Americans to buy up a large chunk of the single-family homes on the market, meaning the pool available for renters shrunk,” Khan said. “The people who own these homes are now hesitant to move because housing costs have soared, and they’re typically locked into low mortgage rates. That makes the single-family-home market locked up for both renters and buyers, and keeps prices high.”
Roughly 1 in 7 Single-Family Homes Are Rentals—a Record-Low Share
Just 13.7% of single-family homes are occupied by renters, the lowest share in records dating back to 2011.

In total, there are 11.3 million single-family-home rentals in the U.S.—the third lowest level on record. By comparison, there are 12.1 million rental units in large multifamily buildings—the highest level on record. There are 10 million rental units in small multifamily buildings, and 3.1 million townhome rentals.

New York Has the Highest Share of Large Multifamily Rentals
In New York, 69.1% of rentals are in large multifamily buildings—the highest share among the 50 most populous U.S. metropolitan areas and more than double the national share. It’s followed by Minneapolis (61.5%), Seattle (52.5%), Miami (51.3%) and Boston (49.9%).
On the other end of the spectrum is Virginia Beach, VA, where just 22.6% of rentals are in large multifamily buildings—the lowest share among the top 50 metros. Next come Cincinnati (23.9%), Detroit (24.4%), Riverside, CA (24.6%) and Warren, MI (24.7%).
In general, the places with the highest shares of multifamily rental stock are more dense and more expensive, which explains why there are so many multifamily rentals.
In New York, just 4.3% of rentals are single-family homes—the lowest share among the top 50 metros. Next come Philadelphia (6.5%), Washington, D.C. (9.4%), Boston (10.4%) and Baltimore (11.1%).
The metros with the highest share of single-family-home rentals are Riverside (49.5%), Nassau County, NY (45.7%), Detroit (45.1%), Sacramento, CA (41%) and Las Vegas (38.9%).
The Sun Belt Has Seen a Boom in Multifamily Rentals Over the Past Decade
In Dallas, 46.3% of rentals are in large multifamily buildings, up from 29.2% in 2014. That 17-percentage-point increase is the largest increase among the top 50 metros. Next come Phoenix (15.9 ppts), Seattle (14.6 ppts), Atlanta (13.7 ppts) and Jacksonville, FL (13.7 ppts).
Zero metros saw a decline. The smallest increases were in New York (0.9 ppts), Nassau County (1.5 ppts), Detroit (2.2 ppts), West Palm Beach, FL (2.9 ppts), and San Francisco (3.5 ppts).
When it comes to single-family rental share, only two metros have seen an increase over the past decade. In Philadelphia, 6.5% of rentals are single-family homes, up 0.2 percentage points from 6.3% in 2014. Anaheim was the other metro that saw an increase (0.01 ppt).
The metros that saw the largest decreases in single-family rental share over the past decade are Phoenix (-11.7 ppts), Charlotte, NC (-9.3 ppts), Tampa, FL (-8.9 ppts), Orlando, FL (-8.7 ppts) and Seattle (-8.7 ppts).
Metro-Level Summary: Share of Rental Stock by Property Type (2024)
The table below includes the 50 most populous U.S. metro areas.
| Metro area | Single-family rentals, as % of all rentals | Large multifamily rentals, as % of all rentals | Small multifamily rentals, as % of all rentals | Townhome rentals, as % of all rentals |
|---|---|---|---|---|
| Anaheim, CA | 25.0% | 39.3% | 24.7% | 11.0% |
| Atlanta, GA | 28.2% | 36.8% | 29.0% | 6.0% |
| Austin, TX | 22.3% | 44.5% | 28.1% | 5.1% |
| Baltimore, MD | 11.1% | 25.6% | 33.9% | 29.4% |
| Boston, MA | 10.4% | 49.9% | 30.5% | 9.3% |
| Charlotte, NC | 33.7% | 29.2% | 30.1% | 7.0% |
| Chicago, IL | 14.8% | 45.0% | 34.8% | 5.4% |
| Cincinnati, OH | 29.7% | 23.9% | 39.6% | 6.9% |
| Cleveland, OH | 27.1% | 35.9% | 26.0% | 11.1% |
| Columbus, OH | 25.6% | 26.0% | 37.4% | 11.1% |
| Dallas, TX | 22.8% | 46.3% | 26.9% | 4.1% |
| Denver, CO | 19.4% | 44.6% | 28.4% | 7.6% |
| Detroit, MI | 45.1% | 24.4% | 21.1% | 9.4% |
| Fort Lauderdale, FL | 17.5% | 43.1% | 29.5% | 9.9% |
| Fort Worth, TX | 31.7% | 29.8% | 33.3% | 5.1% |
| Houston, TX | 27.5% | 42.8% | 26.6% | 3.1% |
| Indianapolis, IN | 33.2% | 25.2% | 34.5% | 7.0% |
| Jacksonville, FL | 34.7% | 30.9% | 28.0% | 6.4% |
| Kansas City, MO | 29.2% | 26.3% | 30.7% | 13.8% |
| Las Vegas, NV | 38.9% | 27.3% | 27.6% | 6.3% |
| Los Angeles, CA | 23.4% | 39.3% | 29.9% | 7.3% |
| Miami, FL | 16.6% | 51.3% | 20.3% | 11.9% |
| Milwaukee, WI | 18.9% | 44.1% | 30.0% | 7.0% |
| Minneapolis, MN | 12.9% | 61.5% | 17.3% | 8.3% |
| Montgomery County, PA | 14.6% | 37.0% | 30.2% | 18.1% |
| Nashville, TN | 27.6% | 34.1% | 30.0% | 8.4% |
| Nassau County, NY | 45.7% | 27.8% | 20.0% | 6.5% |
| National | 31.0% | 33.1% | 27.3% | 8.5% |
| New Brunswick, NJ | 20.0% | 36.1% | 32.5% | 11.4% |
| New York, NY | 4.3% | 69.1% | 23.0% | 3.7% |
| Newark, NJ | 15.0% | 49.3% | 28.7% | 7.0% |
| Oakland, CA | 28.8% | 38.4% | 22.8% | 10.0% |
| Orlando, FL | 28.3% | 31.1% | 33.1% | 7.5% |
| Philadelphia, PA | 6.5% | 36.0% | 16.5% | 41.0% |
| Phoenix, AZ | 36.1% | 35.0% | 23.6% | 5.3% |
| Pittsburgh, PA | 31.6% | 29.8% | 24.0% | 14.6% |
| Portland, OR | 23.5% | 39.6% | 28.5% | 8.3% |
| Providence, RI | 18.2% | 38.4% | 36.7% | 6.6% |
| Riverside, CA | 49.5% | 24.6% | 18.7% | 7.2% |
| Sacramento, CA | 41.0% | 26.8% | 22.9% | 9.3% |
| San Antonio, TX | 33.0% | 30.3% | 32.4% | 4.3% |
| San Diego, CA | 24.4% | 35.8% | 28.1% | 11.7% |
| San Francisco, CA | 15.6% | 44.5% | 31.4% | 8.6% |
| San Jose, CA | 24.0% | 43.7% | 20.4% | 11.9% |
| Seattle, WA | 17.8% | 52.5% | 24.7% | 5.0% |
| St. Louis, MO | 37.3% | 26.1% | 27.9% | 8.8% |
| Tampa, FL | 30.3% | 32.5% | 30.7% | 6.5% |
| Virginia Beach, VA | 26.5% | 22.6% | 34.2% | 16.7% |
| Warren, MI | 27.9% | 24.7% | 38.6% | 8.8% |
| Washington, DC | 9.4% | 47.3% | 29.9% | 13.4% |
| West Palm Beach, FL | 21.7% | 33.1% | 32.0% | 13.2% |
| National—U.S.A. | 31.0% | 33.1% | 27.3% | 8.5% |