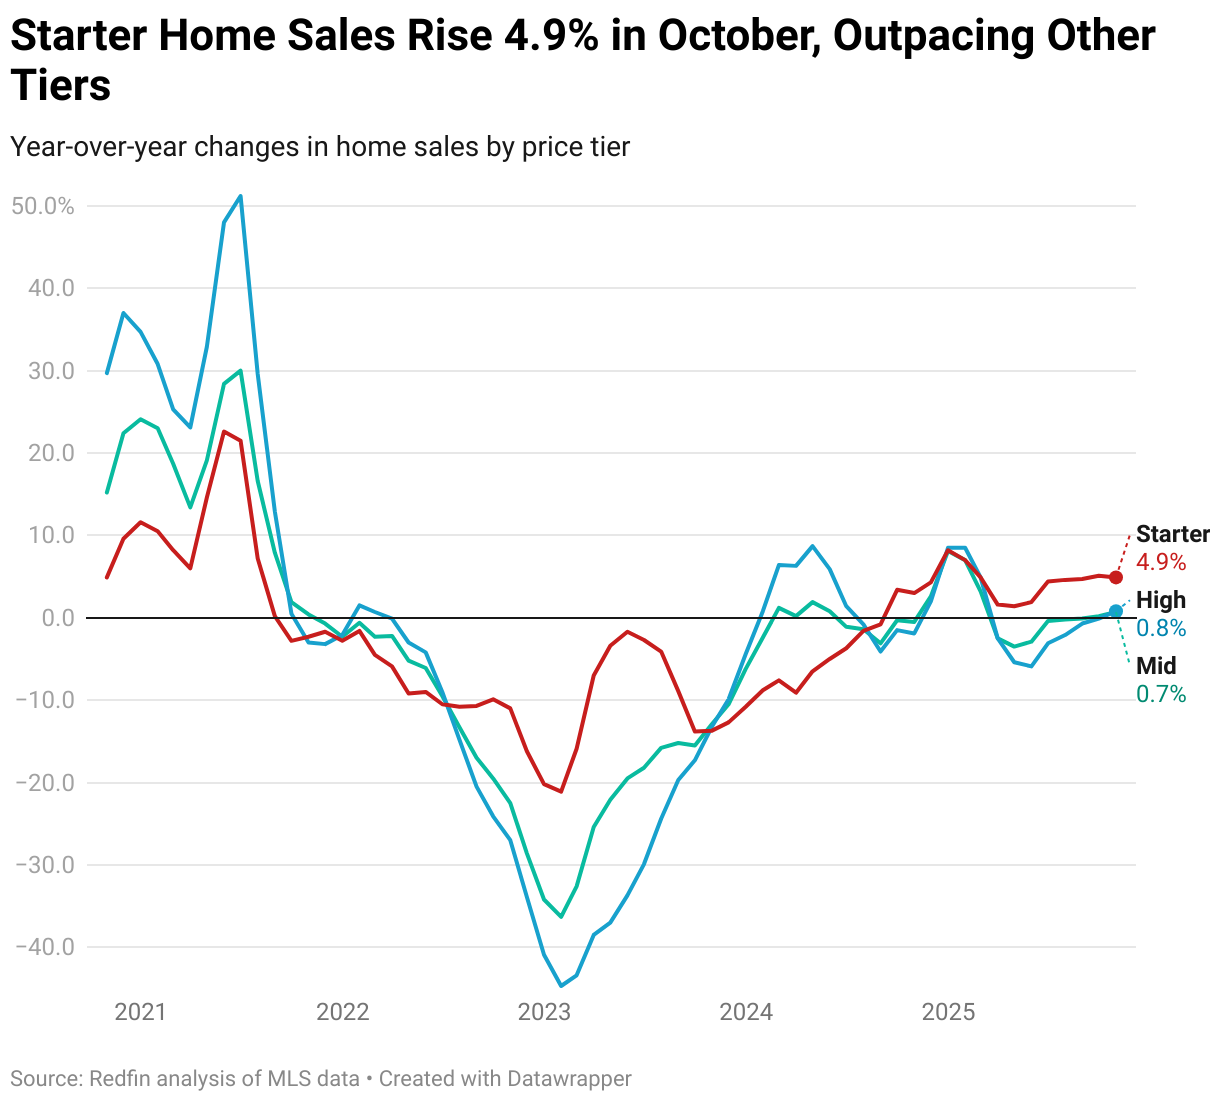
- Starter-home sales rose 4.9% year over year, increasing for the 14th consecutive month. In comparison, sales of mid-priced homes inched up 0.7%, and high-priced home sales rose 0.8%.
- Starter home sale prices rose 2% year over year to a median $260,000 in October.
- Active listings of starter homes rose 13% year over year, pushing inventory to its highest October level since 2016.
- San Francisco recorded the biggest jump in starter-home sales (+19.5%), followed by Providence (+13.0%) and Portland (+12.9%). San Antonio saw the largest decline (-9.6%), trailed by Detroit (-7.9%) and Nashville (-5.5%).
Starter-home sales jumped 4.9% year over year in October as buyers benefited from more choices and modest price growth.
Mid-priced (+0.7%) and high-priced (+0.8%) home sales also rose from a year earlier, a notable change after a long stretch of year-over-year declines.
This is according to a Redfin analysis where we divide U.S. homes into tiers based on the prices of homes sold over a rolling 12-month period. This report focuses on homes whose sale price fell into the 5th–35th percentile, which we define as starter homes. We compare starter homes against mid-priced homes (35th–65th percentile) and high-priced homes (65th–95th percentile). Our price-tier data is calculated in rolling three-month periods, with this report focusing on August–October 2025. Data is subject to revision.
| Housing Data By Home Price Tier (October 2025) | ||||||
| Redfin Home Tiers | Home Price Percentile | Median Sale Price | Median Sale Price YoY | Homes Sold YoY | Pending Sales YoY | Active Listings YoY |
| Starter | 5%-35% | $260,000 | 2.0% | 4.9% | 5.5% | 13.0% |
| Mid | 35%-65% | $373,249 | 1.8% | 0.7% | 1.4% | 9.5% |
| High | 65%-95% | $577,593 | 3.1% | 0.8% | 1.1% | 8.3% |
Starter-home sales have been on an upward trend for more than a year, consistently outperforming the rest of the market through 2025 as buyers shift their focus to the most affordable homes available.
Pending-sales data echoes this trend, with the starter tier seeing the biggest rise (+5.5%), followed by smaller increases for mid-priced (+1.4%) and high-priced (+1.1%) homes.
“The starter-home market is a double-edged sword right now. Conditions are improving, with more listings and steadier prices, but many buyers are only turning to this tier because they have been priced out of higher tiers,” said Redfin Head of Economic Research Chen Zhao. “That means sales at the low end of the market are relatively strong, but it also means that first-time buyers may find themselves competing with move-up or move-down buyers.”
Mortgage rates staying below 6.5% over the past few months is also helping to fuel the uptick in sales across all tiers, with mid- and high-priced homes edging into positive territory after months of year-over-year declines.
Starter-home prices are growing at the second-slowest speed in a decade
The increase in starter-home sales is not causing prices to spike. The typical U.S. starter home price rose a modest 2% year over year to $260,000 in October, the second slowest growth in the past decade—trailing only April 2024 (+1.8%), when mortgage rates were spiking above 7.5%.
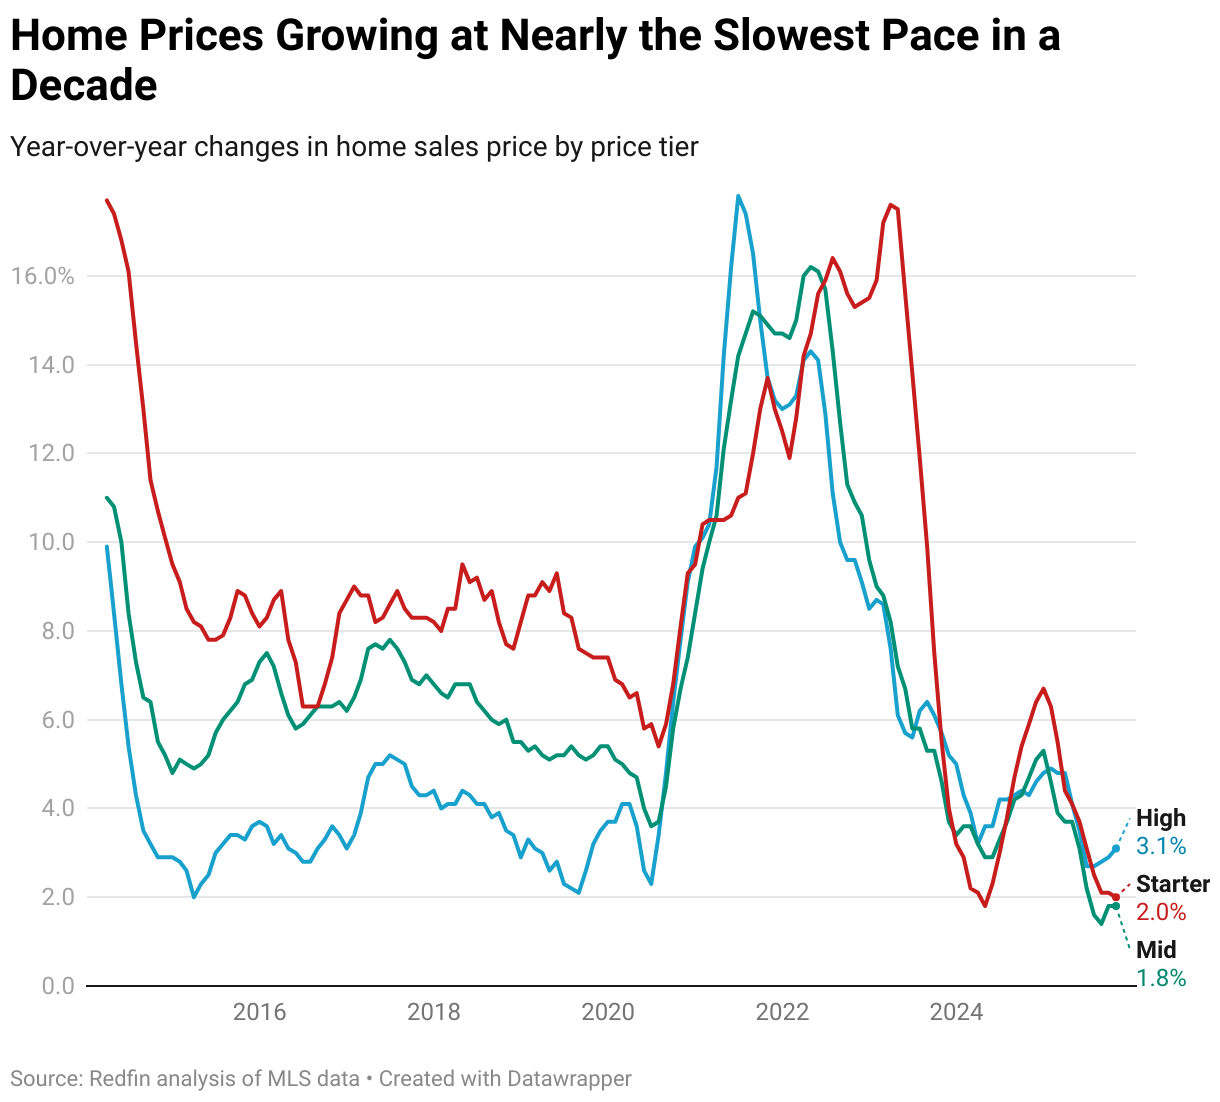
The median price of mid- and high-priced homes rose 1.8% and 3.1% respectively, also near decade-long lows for price growth.
A 13% surge in starter home inventory is helping to keep prices under control
Starter-home prices are rising modestly in part because there are a lot more of them on the market. Active listings of starter homes rose 13% year over year in October, pushing inventory to its highest October level since 2016.
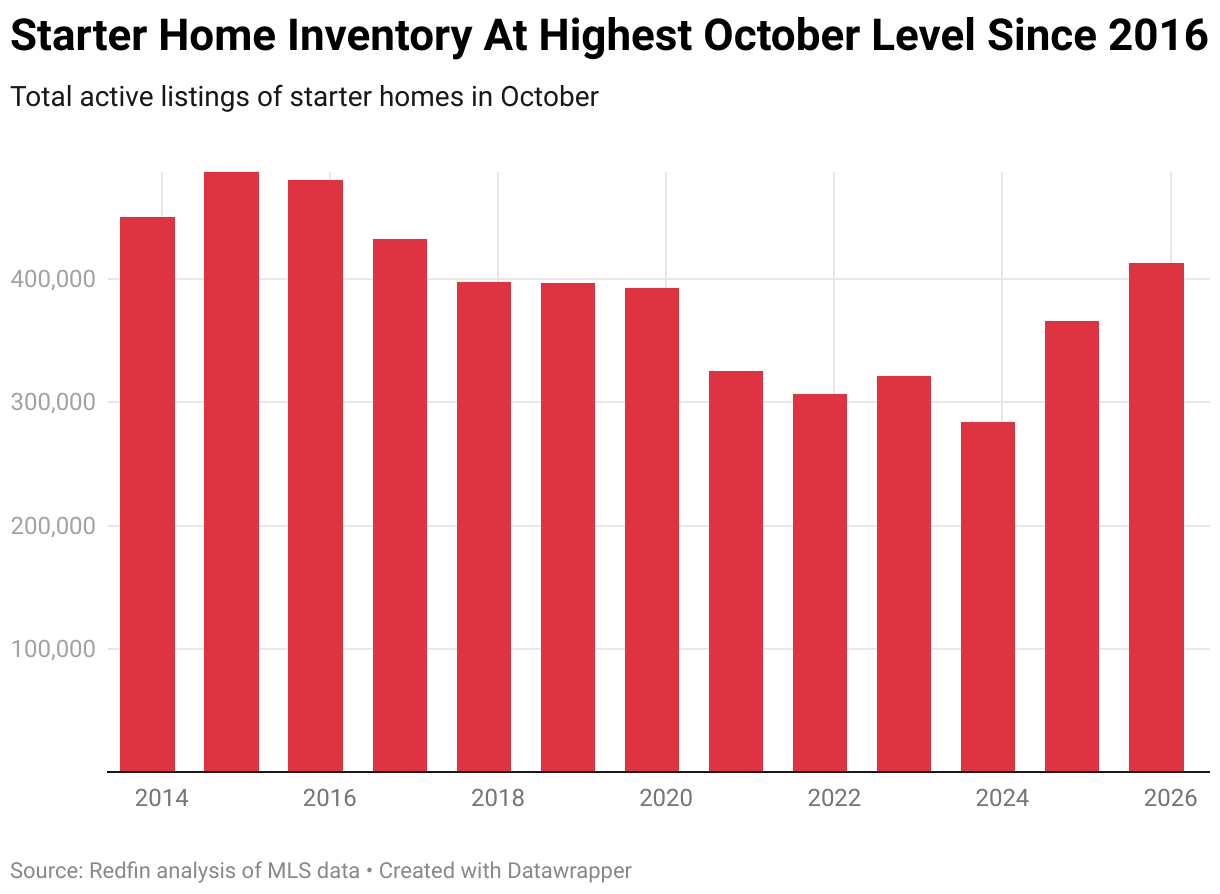
That’s a notable shift for first-time buyers who have spent much of the past five years—and especially the pandemic era—competing over a limited pool of homes at the low end of the market.
Inventory also grew in other price tiers, but not as quickly. Active listings of mid-priced homes increased 9.5% from a year earlier to the highest October level since 2019, and high-priced homes rose 8.3% to the highest October level since 2020.
New listings of starter homes were up just 0.5% year over year, while new listings fell 1.7% in the mid-priced tier and 1.3% in the high-priced tier. That indicates that much of the overall inventory growth across the three price tiers is coming from homes lingering on the market, rather than a sudden surge of new sellers.
The typical starter home went under contract in 45 days in October, a week longer than a year earlier. Mid-priced homes followed the same pattern, also taking 45 days (+6 days year over year), while high-priced homes took 49 days (+7 days year over year).
“The slower pace of the market has really changed buyer behavior,” said Andrew Vallejo, a Redfin Premier real estate agent in Austin. “People aren’t racing to waive contingencies or outbid ten other offers. If a starter home isn’t priced perfectly, it can sit for a bit, and buyers know that. They feel more comfortable negotiating because they’re not worried about losing the home in 24 hours.”
Metro-Level Starter Home Highlights: October 2025
Redfin’s metro-level starter home data includes the 50 most populous U.S. metros. Some metros are removed from time to time to ensure data accuracy. All changes noted below are year-over-year changes.
- Prices: The median sale price of starter homes rose most in Milwaukee (10.8% to $221,615), St. Louis (10.0% to $150,747) and Detroit (9.6% to $96,463). The largest declines were in Jacksonville, FL (-4.4% to $247,678), Austin, TX (-4.2% to $316,927) and San Antonio, TX (-3.7% to $216,409).
- Sales: Starter-home sales increased most in San Francisco (19.5%), Providence, RI (13.0%) and Portland, OR (12.9%). They decreased most in San Antonio, TX (-9.6%), Detroit (-7.9%) and Nashville, TN (-5.5%).
- Active listings: The total number of starter homes for sale increased most in Las Vegas (32.1%), Newark, NJ (30.3%) and San Diego, CA (26.5%). Active listings fell most in San Francisco (-5.1%), and also declined slightly in San Jose, CA (-1.7%) and Tampa, FL (-1.2%).
- New listings: New listings of starter homes increased most in Newark, NJ (14.3%), Detroit (11.7%) and St. Louis (10.1%). New listings fell most in Jacksonville, FL (-15.0%), San Antonio, TX (-12.2%) and Orlando, FL (-10.1%).
- Speed of sales: Starter homes sold fastest in Indianapolis with a median of 22 days, followed by Warren, MI (23 days), Boston (23 days) and Kansas City, MO (23 days). They sold slowest in Fort Lauderdale, FL (114 days), West Palm Beach, FL (101 days) and Miami (88 days)
Metro Table — Starter Homes (October 2025)
Top 50 Most Populous U.S. Metro Areas
| Metro | Median Sale Price | Median Sale Price YoY | Homes Sold YoY | Pending Sales YoY | Active Listings YoY | New Listings YoY | Median Days On Market |
|---|---|---|---|---|---|---|---|
| Anaheim, CA | $755,652 | 1.5% | 10.0% | 1.2% | 25.0% | -4.4% | 50 |
| Atlanta, GA | $275,901 | -1.5% | 1.6% | 2.5% | 11.7% | -8.9% | 60 |
| Austin, TX | $316,927 | -4.2% | -2.9% | 1.9% | 15.2% | -5.4% | 84 |
| Baltimore, MD | $240,592 | 5.4% | 4.8% | 4.2% | 17.0% | 5.5% | 36 |
| Boston, MA | $516,606 | 4.5% | 5.9% | -3.5% | 19.8% | 2.3% | 23 |
| Charlotte, NC | $289,973 | 0.8% | 5.1% | 3.0% | 13.1% | -1.9% | 62 |
| Chicago, IL | $230,336 | 5.4% | 4.4% | 1.4% | 6.2% | -1.9% | 54 |
| Cincinnati, OH | $199,342 | 7.1% | 6.9% | -6.1% | 5.6% | -1.9% | 41 |
| Cleveland, OH | $135,691 | 7.3% | 11.8% | 11.4% | 15.5% | 1.9% | 32 |
| Columbus, OH | $220,770 | 0.4% | 3.1% | 6.1% | 13.1% | 0.0% | 45 |
| Dallas, TX | $294,334 | -1.6% | 7.2% | 6.8% | 23.0% | 2.7% | 55 |
| Denver, CO | $426,454 | 0.3% | 4.1% | -2.3% | 18.6% | -6.8% | 42 |
| Detroit, MI | $96,463 | 9.6% | -7.9% | -3.3% | 15.9% | 11.7% | 37 |
| Fort Lauderdale, FL | $228,136 | -0.6% | 7.3% | 13.5% | 14.1% | -0.6% | 114 |
| Fort Worth, TX | $270,000 | -1.3% | 3.2% | 4.5% | 4.9% | -5.4% | 49 |
| Houston, TX | $242,364 | -1.1% | 6.5% | 11.9% | 16.0% | -7.0% | 53 |
| Indianapolis, IN | $202,926 | 3.5% | 3.0% | 4.2% | 18.0% | 6.3% | 22 |
| Jacksonville, FL | $247,678 | -4.4% | -2.2% | 6.2% | -0.3% | -15.0% | 81 |
| Kansas City, MO | $217,264 | 6.9% | 2.2% | 2.5% | 1.1% | -0.6% | 23 |
| Las Vegas, NV | $346,389 | 2.9% | -0.1% | 3.8% | 32.1% | -1.7% | 53 |
| Los Angeles, CA | $641,599 | 3.7% | 9.1% | 7.6% | 23.9% | 1.5% | 54 |
| Miami, FL | $346,799 | 0.5% | 2.2% | 18.0% | 22.9% | 3.2% | 88 |
| Milwaukee, WI | $221,615 | 10.8% | 3.7% | 3.7% | 8.7% | 2.2% | 42 |
| Minneapolis, MN | $281,766 | 2.5% | 9.2% | 3.4% | 13.5% | 5.9% | 28 |
| Montgomery County, PA | $339,262 | 3.9% | 6.0% | 4.1% | 14.6% | 3.7% | 25 |
| Nashville, TN | $336,744 | 0.0% | -5.5% | 0.4% | 15.3% | -1.4% | 64 |
| Nassau County, NY | $544,110 | 7.0% | 9.3% | 7.5% | 14.8% | 5.2% | 31 |
| New Brunswick, NJ | $378,183 | 7.5% | 9.8% | 4.3% | 22.4% | 6.6% | 43 |
| New York, NY | $475,157 | 8.7% | 2.2% | 3.8% | 19.2% | 8.6% | 59 |
| Newark, NJ | $400,790 | 7.2% | 5.5% | 12.4% | 30.3% | 14.3% | 36 |
| Oakland, CA | $606,267 | -3.1% | 3.3% | 0.8% | 11.0% | -3.4% | 36 |
| Orlando, FL | $297,663 | 2.6% | 4.2% | 5.7% | 8.5% | -10.1% | 54 |
| Philadelphia, PA | $169,931 | 5.7% | -0.3% | 4.0% | 10.9% | 2.0% | 46 |
| Phoenix, AZ | $349,967 | -0.1% | 8.5% | 7.1% | 20.0% | -1.0% | 65 |
| Pittsburgh, PA | $139,984 | 8.3% | 6.1% | 9.9% | 6.6% | -1.1% | 60 |
| Portland, OR | $420,362 | 1.0% | 12.9% | 5.4% | 23.8% | 0.2% | 38 |
| Providence, RI | $376,555 | 6.6% | 13.0% | 6.3% | 10.3% | 5.9% | 28 |
| Riverside, CA | $426,598 | 1.9% | 11.7% | 17.0% | 18.4% | 2.9% | 61 |
| Sacramento, CA | $437,778 | -0.1% | 7.1% | 7.3% | 20.4% | -6.6% | 36 |
| San Antonio, TX | $216,409 | -3.7% | -9.6% | -5.9% | 4.3% | -12.2% | 74 |
| San Diego, CA | $655,018 | 1.8% | 9.9% | 7.9% | 26.5% | 3.9% | 37 |
| San Francisco, CA | $958,977 | -0.6% | 19.5% | 20.2% | -5.1% | -7.7% | 33 |
| San Jose, CA | $974,494 | -0.5% | -2.3% | -1.2% | -1.7% | -3.1% | 28 |
| Seattle, WA | $577,300 | 0.7% | -0.8% | 5.9% | 24.2% | -0.3% | 24 |
| St. Louis, MO | $150,747 | 10.0% | 3.5% | 5.0% | 19.7% | 10.1% | 34 |
| Tampa, FL | $255,852 | -2.7% | 4.9% | 9.6% | -1.2% | -5.1% | 56 |
| Virginia Beach, VA | $256,860 | 2.7% | 2.2% | -0.5% | 13.0% | 1.9% | 33 |
| Warren, MI | $198,966 | 5.7% | 5.0% | 8.4% | 13.4% | 2.4% | 23 |
| Washington, DC | $389,341 | 2.9% | 0.6% | -1.7% | 25.8% | 4.1% | 45 |
| West Palm Beach, FL | $270,430 | -2.1% | 6.9% | 16.5% | 10.1% | 3.4% | 101 |