
- Pending starter home sales grew 10% in July year over year, while other price brackets fell.
- The median price for a U.S. starter home climbed to $250,000 in July, but price growth was slower than for other price brackets.
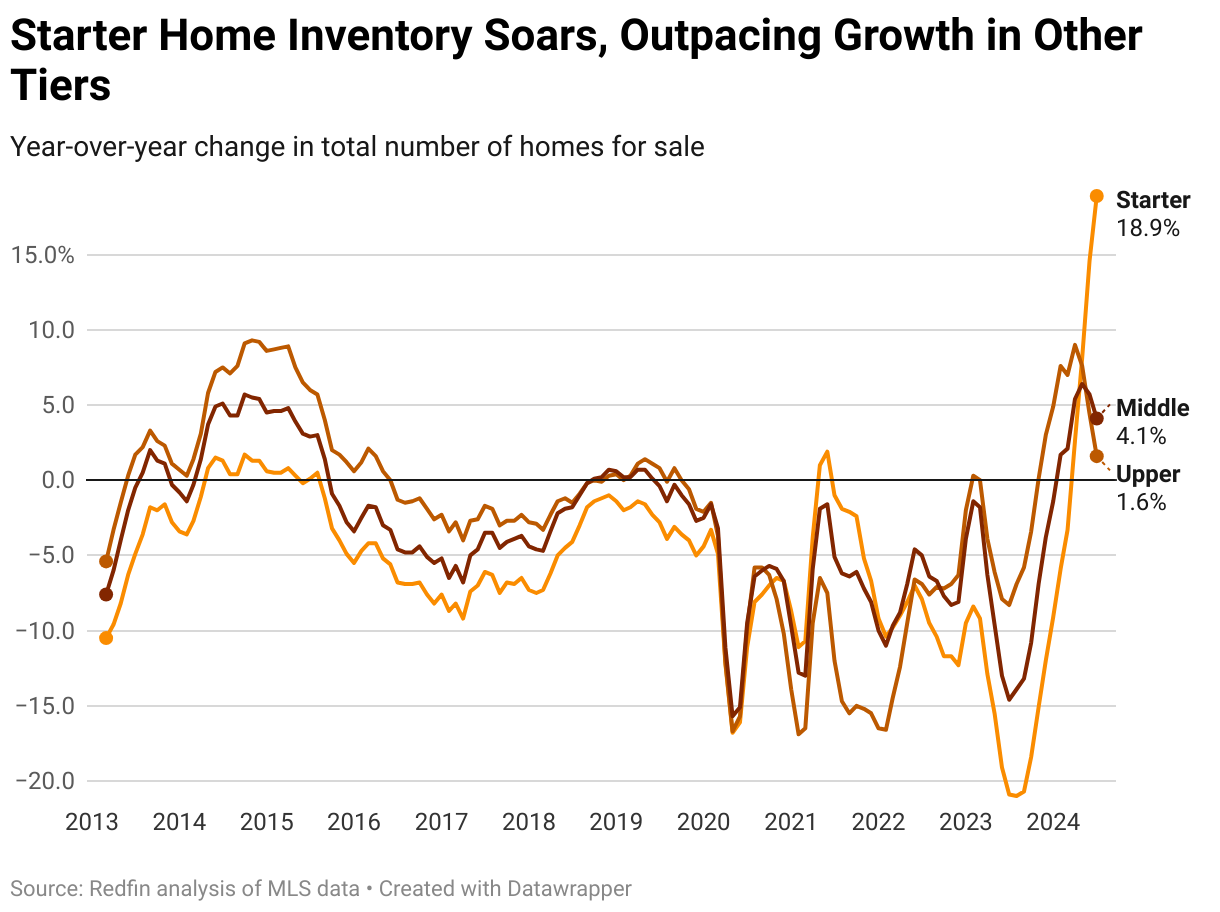
- Starter homebuyers are moving off the sidelines as mortgage rates fall and inventory rises.
Pending sales of starter homes climbed 10.2% year over year in July to the highest level since October 2022, showing there may be signs of life for first time homebuyers at the lower end of an otherwise sluggish market.

This is according to a Redfin analysis where we divided all U.S. homes into buckets based on Redfin Estimates of market values as of August 2024. This report is focused on homes whose sale price fell into the 5th-35th percentile, which we define as starter homes. Our price-tier data is calculated in rolling 3-month periods, with this report focusing on May-July.
Pending sales of middle-price homes (where the sales price was in the 35th-65th percentile of the market) fell 6.5% in July compared to a year earlier, while upper-price homes (65th-95th percentile) fell even more, down 10%.
| Redfin Home Tiers | Home Value Percentile | Sale Price YoY (July) | Median List Price YoY (July) | Pending Sales YoY (July) | Homes Sold YoY (July) | Active Listings YoY (July) |
| Starter | 5%-35% | 4.2% | 8.4% | 10.2% | -0.6% | 18.9% |
| Middle | 35%-65% | 4.6% | 6.8% | -6.5% | -3.9% | 4.1% |
| Upper | 65%-95% | 5.0% | 6.8% | -10% | -3.4% | 1.6% |
| Luxury | Top 5% | 7.9% | 8.0% | -7.9% | -1.7% | 9.0% |
One reason starter home pending sales may be strengthening is the recent fall in mortgage rates, which began in mid-July. First-time homebuyers, who make up a significant proportion of the starter-home market, are more sensitive to rate drops as they are less likely to have a large downpayment, meaning rate changes have a greater impact on their monthly payments.
“The overall market remains sluggish, but we are beginning to see first-time homebuyers come off the sidelines, buoyed by falling mortgage rates and an increased number of homes hitting the market,” said Redfin Senior Economist Sheharyar Bokhari. “Not only do you have young families and investors looking at starter homes, you also have buyers who have been forced to consider less-expensive options due to near-record home prices. More buyers means more sales, but so far we aren’t seeing prices skyrocket, because the rising number of homes hitting the market is enough to satisfy the increased demand—a positive outcome for both buyers and sellers.”
Starter home sales dipped slightly, but outperformed other price tiers
Closed sales of starter homes fell 0.6% last month compared to a year earlier, but still outpaced middle- and upper-price homes, which fell 3.9% and 3.4% respectively.
Movement in sales results typically trails pending sales by a month or more, due to the time it takes for a home sale to close. That means future starter home sales should strengthen even more in August due to July’s spike in pending sales.

“Lower-priced homes are really moving right now, especially since rates went down to around 6.5%,” said Derrell Skillman, a Redfin Premier agent in San Antonio, where pending sales of starter homes rose 22% last month. “We are seeing a lot of younger buyers looking at smaller starter homes. They don’t want a big backyard and a pool, they just want something efficient, with minimal ongoing maintenance required.”
Starter home prices rising more slowly than other tiers as inventory soars
The typical U.S. starter home sold for a record $250,000 in July, up 4.2% year over year. That price growth was slower than middle- and upper-price tiers, which rose 4.6% and 5% respectively.
Increased inventory levels helped to keep starter home price growth lower than other brackets. The number of starter homes on the market spiked 18.9% year over year to the highest level seen since October 2022, pushed by an 18.8% rise in new listings. Meanwhile, inventory in the middle- and upper-price tiers increased by just 4.1% and 1.6%, respectively.
Despite the increase, it’s worth noting that inventory is still sitting well below pre-pandemic levels. For example, there were roughly 30% more starter homes on the market in July 2019 than July this year.
Starter home prices fall in Texas and Florida metros as inventory piles up
Major Texas and Florida metros saw some of the biggest declines in home prices in July, year over year, aided by significant spikes in inventory. The five metros which saw the biggest decline in price were Austin, TX (-3.9% sales price, +17.4% active listings), San Antonio (-2.6% sales price, +50.2% active listings), West Palm Beach, FL (-2% sales price, +34.8% active listings), Fort Lauderdale, FL (-1.9% sales price, +47.5% active listings) and Dallas (-1.6% sales price, +38.5% active listings).
Metro-Level Starter Home Highlights: May-July 2024
Redfin’s metro-level starter home data includes the 50 most populous U.S. metros. Some metros are removed from time to time, to ensure data accuracy. All changes noted below are year-over-year changes.
- Prices: The median sale price of starter homes rose most in Detroit (15.6% increase to $67,500), Newark, NJ (15.4% increase to $375,000) and Pittsburgh (13.6% increase to $117,000). It largest falls were in Austin, TX (-3.9% to $326,700), San Antonio (-2.6% to $202,500) and West Palm Beach, FL (-2% to $245,000).
- Sales: Starter home sales increased most in San Francisco, (18.7%), San Jose, CA (14.5%) and Cincinnati, OH (12.4%). They decreased most in Fort Lauderdale, FL (-19.6%), West Palm Beach, FL (-17.2%) and Phoenix (-11.9%).
- Active listings: The total number of starter homes for sale increased most in San Antonio (50.2%), Fort Worth, TX (49.6%) and Tampa, FL (48.1%). Only one metro—Milwaukee—saw a fall in active listings (-4.1%).
- New listings: New listings of starter homes increased most in Fort Worth, TX (40.4%). Nassau County, NY (39.5%) and San Antonio, TX (38.3%). New listings fell in Atlanta (-6.5%) and Milwaukee (-5.2%).
- Speed of sales: Starter homes sold fastest in Seattle with a median of seven days, followed by Montgomery County, PA (11 days) and Warren County, MI (12 days). They sold slowest in Fort Lauderdale, FL (81 days), West Palm Beach, FL (77 days) and Miami (67 days).
| Starter Home-Market Summary by Metro Area: May-July 2024
50 most populous U.S. metros |
|||||||
| Region Name | Median sale price | Median sale price, YoY | Homes sold, YoY | Pending sales, YoY | Active listings, YoY | New listings, YoY | Median days on market |
| Anaheim, CA | $729.0K | 7.21% | -0.40% | 12.00% | 15.10% | 26.16% | 28 |
| Atlanta, GA | $265.0K | 1.96% | -4.10% | -7.50% | 2.60% | -6.45% | 36 |
| Austin, TX | $326.7K | -3.91% | -7.10% | -1.20% | 17.40% | 12.09% | 45 |
| Baltimore, MD | $220.0K | 6.80% | -3.40% | 3.80% | 15.10% | 15.18% | 24 |
| Boston, MA | $490.0K | 7.69% | 6.70% | 22.60% | 27.50% | 34.00% | 19 |
| Charlotte, NC | $257.0K | 4.90% | 0.70% | 10.00% | 26.40% | 24.14% | 47 |
| Chicago, IL | $207.0K | 10.70% | -5.20% | 3.30% | 0.70% | 7.98% | 46 |
| Cincinnati, OH | $180.0K | 11.18% | 12.40% | 28.10% | 32.70% | 33.49% | 33 |
| Cleveland, OH | $125.0K | 12.61% | -1.70% | 8.20% | 4.90% | 12.56% | 21 |
| Columbus, OH | $199.0K | 7.60% | 12.20% | 21.70% | 24.40% | 28.92% | 35 |
| Dallas, TX | $273.6K | -1.58% | -1.70% | 12.10% | 38.50% | 29.64% | 34 |
| Denver, CO | $412.0K | 1.10% | 6.40% | 14.00% | 44.20% | 31.39% | 17 |
| Detroit, MI | $67.5K | 15.88% | 4.00% | 10.00% | 5.00% | 0.49% | 40 |
| Fort Lauderdale, FL | $220.8K | -1.89% | -19.60% | -11.60% | 47.50% | 13.86% | 81 |
| Fort Worth, TX | $243.3K | 0.52% | -1.60% | 22.90% | 49.60% | 40.36% | 33 |
| Houston, TX | $218.0K | 1.40% | -6.50% | 3.60% | 27.70% | 12.76% | 33 |
| Indianapolis, IN | $171.3K | 7.10% | -2.30% | 6.40% | 12.60% | 9.55% | 13 |
| Jacksonville, FL | $236.0K | 0.43% | -4.60% | 6.40% | 40.10% | 24.63% | 54 |
| Kansas City, MO | $180.0K | 2.86% | -1.10% | 8.30% | 19.80% | 12.10% | 21 |
| Las Vegas, NV | $297.0K | 2.41% | -8.60% | 2.40% | 11.50% | 14.98% | 38 |
| Los Angeles, CA | $610.0K | 6.18% | -3.00% | 11.50% | 19.70% | 21.19% | 35 |
| Miami, FL | $320.0K | 4.92% | -0.50% | -0.20% | 38.70% | 18.96% | 67 |
| Milwaukee, WI | $188.5K | 7.71% | -3.10% | -1.60% | -4.10% | -5.19% | 37 |
| Minneapolis, MN | $265.0K | 1.92% | 1.80% | 11.00% | 25.20% | 20.21% | 20 |
| Montgomery County, PA | $325.0K | 8.33% | 7.20% | 14.30% | 20.30% | 21.03% | 11 |
| Nashville, TN | $310.0K | 2.39% | -6.60% | -6.80% | 12.70% | 12.87% | 41 |
| Nassau County, NY | $521.0K | 9.68% | -6.90% | 30.00% | 25.40% | 39.53% | 23 |
| New Brunswick, NJ | $349.0K | 9.06% | -4.10% | 9.40% | 7.60% | 23.13% | 27 |
| New York, NY | $450.0K | 5.88% | -1.10% | 12.70% | 3.60% | 17.84% | 48 |
| Newark, NJ | $375.0K | 15.38% | 0.90% | 21.80% | 13.70% | 20.13% | 21 |
| Oakland, CA | $625.0K | 0.81% | -0.90% | 8.10% | 27.30% | 21.93% | 18 |
| Orlando, FL | $263.8K | 1.87% | -6.70% | 1.40% | 38.40% | 21.46% | 34 |
| Philadelphia, PA | $137.0K | 5.38% | 10.60% | 25.70% | 8.20% | 16.09% | 44 |
| Phoenix, AZ | $320.0K | -0.93% | -11.90% | 0.40% | 17.70% | 18.46% | 50 |
| Pittsburgh, PA | $117.0K | 13.59% | 4.50% | 19.60% | 11.60% | 27.49% | 47 |
| Portland, OR | $415.0K | 1.22% | 9.90% | 13.90% | 22.70% | 12.65% | 16 |
| Providence, RI | $356.9K | 8.15% | 4.50% | 18.50% | 20.10% | 26.43% | 16 |
| Riverside, CA | $405.0K | 4.38% | -8.00% | 0.20% | 9.80% | 6.77% | 41 |
| Sacramento, CA | $427.0K | 2.89% | -0.50% | 17.10% | 35.30% | 32.42% | 14 |
| San Antonio, TX | $202.5K | -2.64% | 3.20% | 26.60% | 50.20% | 38.32% | 36 |
| San Diego, CA | $650.0K | 5.35% | 2.20% | 16.60% | 37.60% | 27.00% | 16 |
| San Francisco, CA | $945.0K | 5.00% | 18.70% | 38.20% | 28.30% | 32.53% | 24 |
| San Jose, CA | $960.0K | 3.95% | 14.50% | 19.10% | 36.60% | 37.10% | 16 |
| Seattle, WA | $555.0K | 2.78% | -1.90% | 4.70% | 20.40% | 19.88% | 7 |
| St. Louis, MO | $125.0K | 8.70% | -3.00% | 9.10% | 8.50% | 10.22% | 27 |
| Tampa, FL | $249.9K | 1.17% | -1.90% | 4.70% | 48.10% | 25.42% | 37 |
| The United States | $250.0K | 4.17% | -0.60% | 10.20% | 18.90% | 18.77% | 31 |
| Virginia Beach, VA | $240.0K | 4.35% | -9.30% | -6.30% | 12.00% | 7.24% | 22 |
| Warren, MI | $185.0K | 6.94% | -3.60% | -0.20% | 6.60% | 5.33% | 12 |
| Washington, DC | $360.0K | 3.75% | 1.90% | 4.10% | 16.20% | 14.61% | 28 |
| West Palm Beach, FL | $245.0K | -2.00% | -17.20% | -11.20% | 34.80% | 15.52% | 77 |


