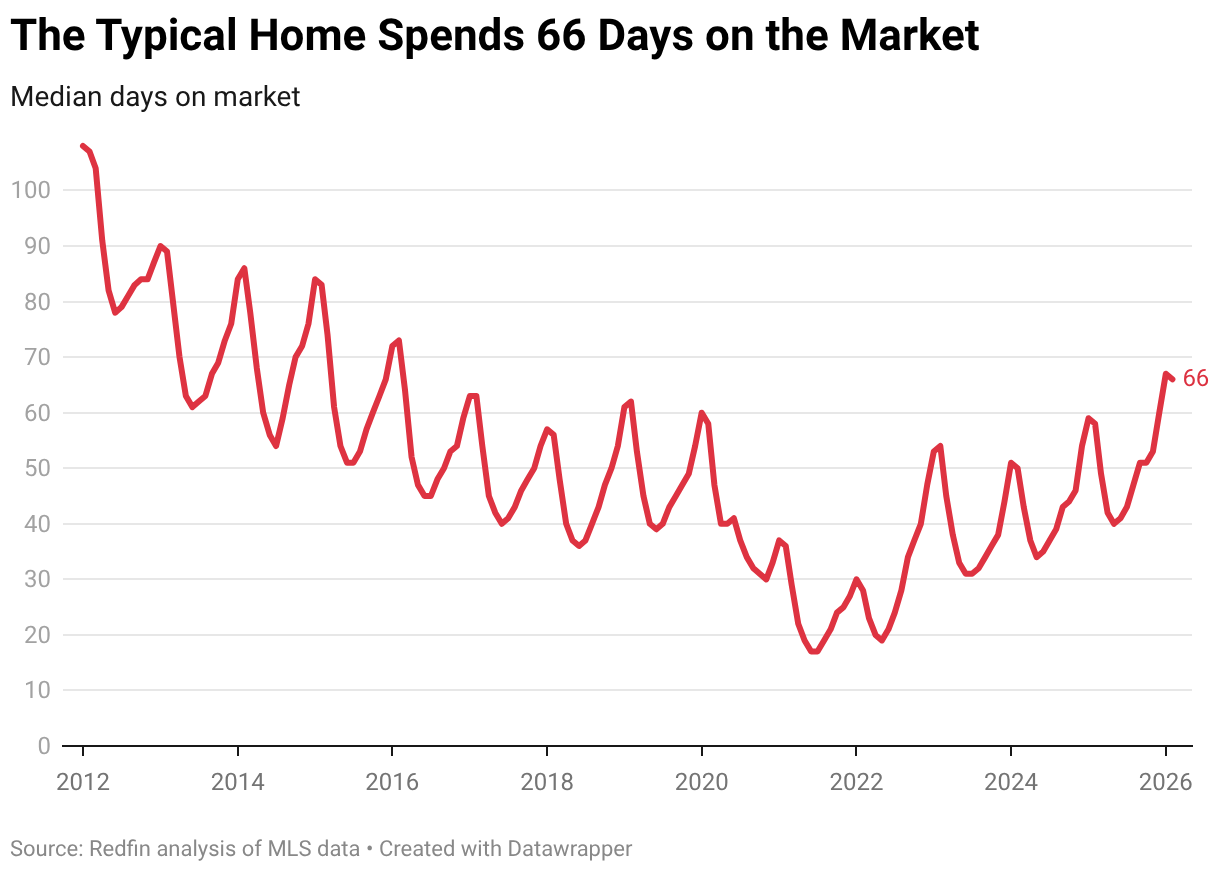
- The typical home that went under contract in February spent 66 days on the market—the slowest February pace in a decade.
- The typical buyer scored 1.8% off the list price—the biggest February discount since 2023; sellers outnumber buyers, giving buyers negotiating power.
- Pending home sales and new listings both inched down last month, while home prices inched up.
U.S. homebuyers are taking their time as we head into spring, which is usually the busy season for the housing market.
The typical home that went under contract in February spent 66 days on the market. That’s the slowest February pace since 2016 and is up from 58 days a year earlier.
“House hunters have been waiting for mortgage rates to drop, and they finally fell below 6% a couple of weeks ago, which was great. One of our agents had a client lock in a 5.6% rate,” said Redfin Senior Economist Asad Khan.“But then rates bounced back. The war in Iran, skyrocketing gas prices and other economic jitters are making homebuyers nervous.”
Economic uncertainty isn’t the only factor causing homebuyers to slow their roll. It’s a buyer’s market, with sellers outnumbering buyers by more than 40%. That means the buyers who are in the market have negotiating power and can afford to take their time.
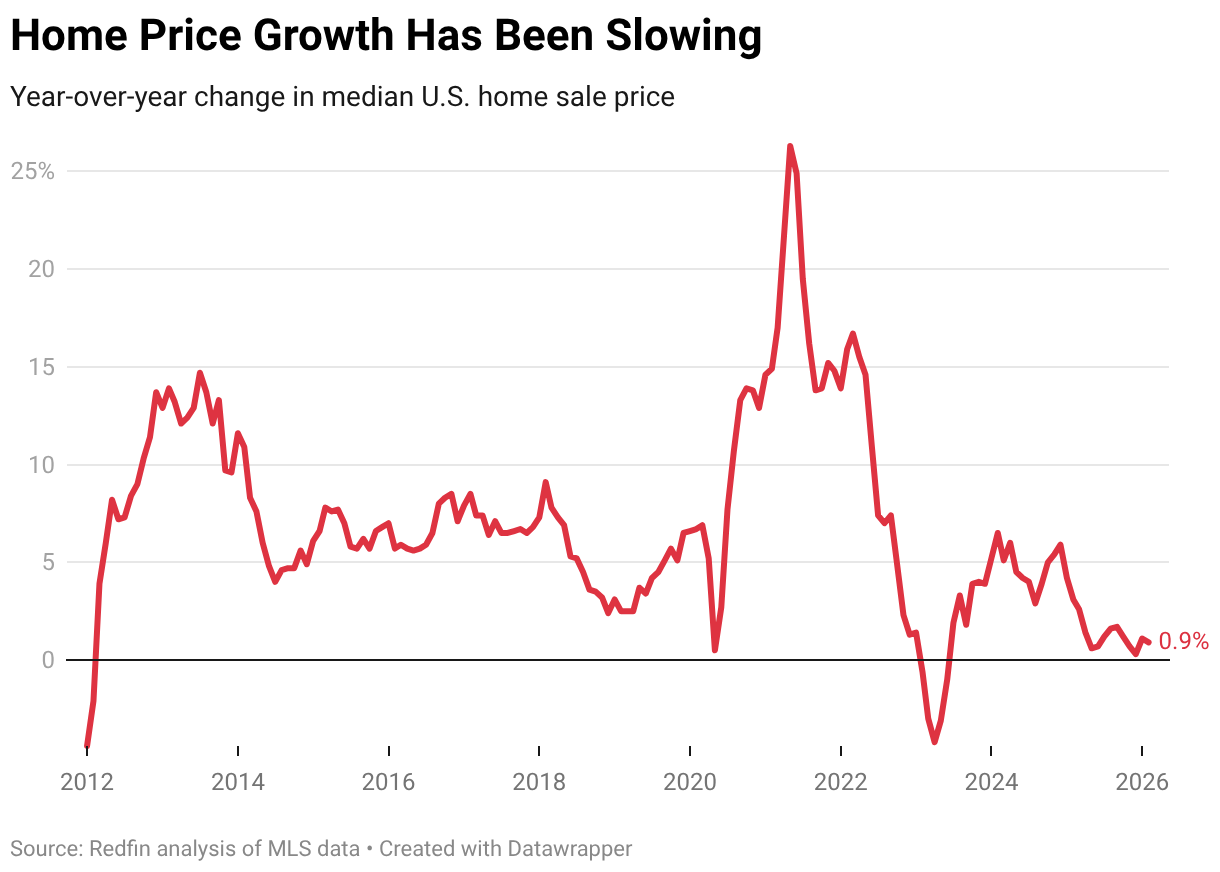
The typical homebuyer in February paid 1.8% less than the final list price, the largest discount for this time of year since 2023. The median home sale price was $429,259, up 0.9% from a year earlier. While home prices continue to grow, this growth pales in comparison to the double-digit gains we saw during the pandemic homebuying frenzy.
Pending Home Sales and Listings Both Ticked Down Last Month
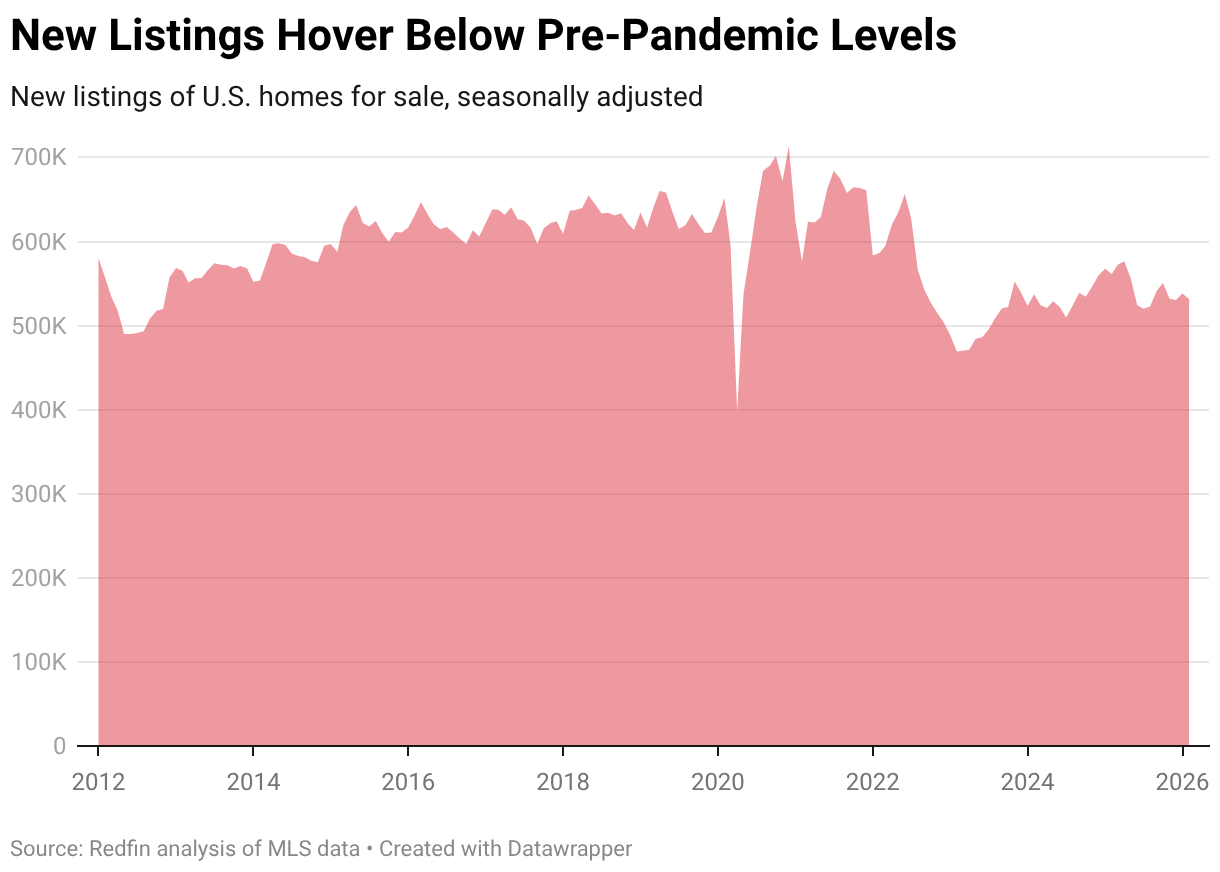
Homebuying and selling activity were both muted in February. Pending home sales fell 0.8% month over month on a seasonally adjusted basis, while new listings fell 1.2%.
An early look at March data shows that more sellers may be testing the waters, and some sellers who delisted their homes last year are considering relisting in hopes of an uptick in spring demand.
February 2026 Housing Market Highlights: United States
| February 2026 | Month-over-month change | Year-over-year change | |
|---|---|---|---|
| Median sale price | $429,259 | 1.5% | 0.9% |
| Existing-home sales, seasonally adjusted annual rate | 4,177,172 | -0.5% | -2.0% |
| Pending home sales, seasonally adjusted | 471,069 | -0.8% | -2.4% |
| Homes sold, seasonally adjusted | 423,890 | 0.2% | -3.1% |
| New listings, seasonally adjusted | 531,403 | -1.2% | -5.3% |
| Total homes for sale, seasonally adjusted (active listings) | 1,989,027 | -0.4% | 1.5% |
| Months of supply | 3.9 | -0.5 | 0 |
| Median days on market | 66 | 0 | 8 |
| Share of homes that sold above final list price | 22.5% | 1.4 ppts | -2.2 ppts |
| Average sale-to-final-list-price ratio | 98.2% | 0.3 ppts | -0.3 ppts |
|
Pending sales that fell out of contract, as % of overall pending sales |
13.7% | 0.5 ppts | 0.8 ppts |
| Monthly average 30-year fixed mortgage rate | 6.05% | -0.05 ppts |
-0.79 ppts |
February 2026 Metro-Level Highlights
The figures below are based on a list of the 50 most populous U.S. metropolitan areas. Some metros may be removed from time to time to ensure data accuracy. Refer to our metrics definition page for explanations of metrics used in this report. Metro-level data are not seasonally adjusted. All changes below represent year-over-year changes.
- Prices: Median sale prices rose most from a year earlier in St. Louis (7.6%), Newark, NJ (5.6%) and Kansas City, MO (4.6%). They fell most in Oakland, CA (-5.6%), Austin, TX (-4.2%) and Denver (-4.2%).
- Pending home sales: Pending sales rose most in San Jose, CA (11%), Milwaukee (10.8%) and Portland, OR (8%). They fell most in Nassau County, NY (-21.1%), Oakland (-17.6%) and Providence, RI (-12.5%).
- Closed home sales: Home sales rose most in Kansas City, MO (12.3%), San Jose (10%) and Jacksonville, FL (6.9%). They fell most in Providence (-15.4%), Newark (-12.2%) and San Antonio (-12.2%).
- New listings: New listings rose most in Kansas City, MO (15.7%), Milwaukee (15.4%) and Portland, OR (13.3%). They fell most in Nassau County (-25.7%), Providence (-20.4%) and New Brunswick, NJ (-18.1%).
- Active listings: Active listings rose most in Seattle (17.4%), Detroit (14.5%) and Washington, D.C. (10.8%). They fell most in Jacksonville (-15.6%), San Francisco (-15.1%) and Nassau County (-12.1%).
- Days on market: In San Antonio, the typical home that went under contract did so in 109 days, which was 28 days longer than a year earlier—the biggest increase among the metros analyzed. Next came Las Vegas (+21 days) and Charlotte, NC (+19 days). San Francisco was the only metro that saw a decrease (-1 day).
- Sold above list price: In San Francisco, 61.9% of homes sold above their final list price, the highest share among the metros analyzed. Next came San Jose (60.6%) and Oakland (55.2%). The lowest shares were in West Palm Beach (5.1%), Miami (7.1%) and Houston (10.3%).
February 2026 Full Metro-Level Data
| U.S. metro area | Median sale price | Median sale price, Y/Y change | Pending sales, Y/Y change | Homes sold, Y/Y change | New listings, Y/Y change | Active listings, Y/Y change | Median days on market | Median days on market, Y/Y change |
|---|---|---|---|---|---|---|---|---|
| Anaheim, CA | $1,200,000 | 0.0% | -8.8% | -7.0% | -5.9% | -4.1% | 46 | 5 |
| Atlanta, GA | $391,680 | 1.1% | -2.8% | -0.9% | -4.4% | 3.9% | 78 | 8 |
| Austin, TX | $412,000 | -4.2% | 6.3% | 3.1% | 4.7% | 4.5% | 110 | 10 |
| Baltimore, MD | $380,000 | 4.0% | 0.8% | -2.4% | -9.7% | 9.2% | 48 | 10 |
| Boston, MA | $690,000 | -2.1% | -6.6% | -8.3% | -12.4% | 1.8% | 36 | 11 |
| Charlotte, NC | $401,000 | 1.5% | N/A | -5.5% | -5.2% | 7.5% | 90 | 19 |
| Chicago, IL | $360,000 | 4.4% | -0.2% | -8.7% | -5.0% | -5.1% | 69 | 1 |
| Cincinnati, OH | $299,900 | 3.4% | -6.0% | -1.8% | -3.3% | 4.7% | 53 | 4 |
| Cleveland, OH | $230,000 | 4.6% | -7.6% | -8.6% | -4.5% | 1.9% | 44 | 4 |
| Columbus, OH | $332,000 | 3.1% | -1.3% | 1.4% | -8.6% | 1.7% | 64 | 9 |
| Dallas, TX | $399,947 | -3.6% | -1.1% | -10.6% | 1.0% | 0.3% | 88 | 17 |
| Denver, CO | $575,000 | -4.2% | 4.4% | -0.9% | 5.1% | 5.5% | 51 | 6 |
| Detroit, MI | $181,250 | 2.7% | -1.8% | -9.2% | 4.8% | 14.5% | 45 | 6 |
| Fort Worth, TX | $353,783 | 1.0% | 0.0% | -8.7% | 0.9% | -3.0% | 79 | 5 |
| Houston, TX | $325,000 | -0.5% | -10.4% | -6.0% | -3.2% | 3.0% | 82 | 18 |
| Indianapolis, IN | $300,000 | 0.7% | -4.5% | -2.9% | -4.1% | 7.5% | 61 | 12 |
| Jacksonville, FL | $365,000 | -1.1% | 4.3% | 6.9% | -17.5% | -15.6% | 88 | 8 |
| Kansas City, MO | $339,900 | 4.6% | N/A | 12.3% | 15.7% | 1.0% | 51 | 1 |
| Las Vegas, NV | $440,000 | -0.6% | -5.5% | -8.7% | -0.9% | 8.2% | 81 | 21 |
| Los Angeles, CA | $905,000 | -1.5% | -6.7% | -7.6% | -5.6% | -3.2% | 63 | 8 |
| Miami, FL | $565,000 | -1.7% | -1.0% | 5.4% | -11.6% | -4.4% | 105 | 11 |
| Milwaukee, WI | $329,900 | 0.0% | 10.8% | 0.3% | 15.4% | 7.9% | 52 | 4 |
| Minneapolis, MN | $380,000 | -1.3% | -5.0% | -7.8% | 3.7% | 2.2% | 63 | 11 |
| Montgomery County, PA | $468,000 | 1.7% | -2.2% | -8.7% | -5.8% | 1.9% | 39 | 1 |
| Nashville, TN | $459,950 | 0.0% | -6.7% | -2.9% | 0.0% | 7.7% | 97 | 13 |
| Nassau County, NY | $730,000 | 2.1% | -21.1% | -2.6% | -25.7% | -12.1% | 41 | 5 |
| New Brunswick, NJ | $545,000 | 2.8% | -11.5% | -10.9% | -18.1% | -3.0% | 57 | 7 |
| New York, NY | $795,000 | 3.9% | -9.8% | -6.5% | -17.8% | -5.6% | 70 | 5 |
| Newark, NJ | $590,000 | 5.6% | -5.5% | -12.2% | -12.5% | 1.5% | 45 | 2 |
| Oakland, CA | $877,750 | -5.6% | -17.6% | -3.5% | -12.5% | -9.3% | 16 | 1 |
| Orlando, FL | $400,000 | 0.0% | -6.2% | -5.1% | -12.0% | -8.1% | 68 | 1 |
| Philadelphia, PA | $280,750 | 2.3% | -9.9% | -8.7% | -15.8% | -2.5% | 62 | 4 |
| Phoenix, AZ | $465,000 | -1.6% | 1.2% | -1.9% | -8.1% | 0.6% | 70 | 4 |
| Pittsburgh, PA | $235,000 | 2.2% | -7.1% | -10.0% | -8.3% | -0.5% | 92 | 7 |
| Portland, OR | $539,900 | 0.0% | 8.0% | 0.0% | 13.3% | 4.3% | 57 | 11 |
| Providence, RI | $491,500 | 2.4% | -12.5% | -15.4% | -20.4% | -3.9% | 39 | 3 |
| Riverside, CA | $579,000 | -1.9% | -3.9% | -3.3% | -11.2% | -9.4% | 71 | 10 |
| Sacramento, CA | $571,500 | -2.0% | 0.0% | 1.0% | -9.0% | -1.9% | 37 | 6 |
| San Antonio, TX | $295,000 | 1.8% | -1.6% | -12.2% | -12.9% | -0.8% | 109 | 28 |
| San Diego, CA | $899,000 | -0.1% | 0.3% | 2.2% | -5.5% | -3.4% | 35 | 6 |
| San Francisco, CA | $1,545,000 | 3.0% | 6.6% | 4.6% | -5.3% | -15.1% | 14 | -1 |
| San Jose, CA | $1,562,000 | -1.1% | 11.0% | 10.0% | -1.9% | -4.1% | 12 | 2 |
| Seattle, WA | $803,000 | 0.4% | -8.6% | -8.1% | 11.8% | 17.4% | 26 | 13 |
| St. Louis, MO | $269,000 | 7.6% | N/A | -0.6% | 7.7% | 10.4% | 40 | 3 |
| Tampa, FL | $382,000 | 3.2% | -7.8% | -9.8% | -11.3% | -6.5% | 65 | 10 |
| Virginia Beach, VA | $360,000 | 2.9% | -4.5% | 1.3% | 4.5% | -1.4% | 46 | 5 |
| Warren, MI | $300,000 | 3.4% | -7.4% | -10.2% | 3.0% | 7.9% | 42 | 11 |
| Washington, DC | $564,393 | 1.7% | 3.9% | -0.6% | 2.5% | 10.8% | 52 | 16 |
| West Palm Beach, FL | $527,000 | -3.3% | 6.0% | 3.2% | -0.3% | -3.2% | 93 | 2 |